Don’t Sell in May and Run Away
The month of May is notable for Cinco de Mayo, Earth Day, National Teachers Day and family celebrations on Mother’s Day. It is a month that culminates the transition from spring to the first day of summer as patterns in life and nature continue.
A bit more ominous, Mayday is an emergency procedure word used internationally as a distress signal in voice procedure radio communications. It derives from the French phrase “venez m’aider”, meaning “come help me”. Could this distress signal be a precursor for the stock market adage which warns investors to “Sell in May and go away?” *
This popular market-maxim is based on the concept of seasonality, specifically that stocks perform better in the 6 winter/spring months than they do in the summer/fall. In such strategies, stocks are sold at the start of May, then are bought back again in the fall around Halloween. The “Halloween Indicator” inversely indicates that stocks perform better between Oct. 31st and May 1st.
Seasonal Patterns
While we are skeptical of seasonal calendar market-timing patterns and maxims that rhyme, the S&P 500 has gained +7.1% on average and risen +77.5% of the time during the six months ending in April (since 1950), versus a paltry +1.7% average gain during the six months ending in October while increasing only +64.8% of the time.
What this tells us, is that historically the summer months have been slower than the winter months. There is less market swaying news released over the dog days of summer and less activity on the street with many institutional traders and Wall Street tycoons heading out to the Hamptons and perhaps now down to South Florida for a summer break.
Still, the odds have been in investors favor. As April showers bring May flowers, a recent chart by LPL Financial illustrates that in eight of the past 10 years, stocks have risen during the May-October “undesirable” summer- stretch. Four of those years brought in remarkable returns of 7.1% up to 12.3%. When the S&P 500 closes at a new monthly high in April, like it did this year, the next six months have performed much better, up 5.6%.
Cyclical Patterns (Bulls & Bears)
Now in a new bull market with the S&P 500 index up over 70% from the March 2020 “COVID19-crash” bottom, investors have some doubts on the market reaching new milestones given the high valuations of stocks and the potential for long term interest rates to resume their upward march fueled while diminishing bond values like we saw in 2013.
Experiencing a few speedbump pullbacks, or a 10%-14% more serious correction of the S&P 500 index would not come as any shock or surprise even while America’s economy is boomeranging strongly out from the pandemic shutdown fueled in part by huge amounts of monetary (quantitative easing) and fiscal stimulus. Historically, the US markets have experienced a 10%-14% pullback every year for the past two decades. In part, this time may not be any different.
Just like seasonal stock patterns and results, bull and bear markets are not created equal and do not operate on a set schedule like the earth revolving around the sun. The history of modern market and economic cycles suggests that while downturns may be sudden and deep, the subsequent expansions more than make up the difference.
What a Soaring Economy Means for Investors
Economic growth is heating up as consumers spend more, businesses ramp up activity and record amounts of government stimulus flow through the system. In general, this is great news and represents the rosiest scenario that economists could have imagined just a year ago. However, such exceptional growth and market returns also call into question the sustainability of the business cycle. How can investors maintain balance in their portfolios when both the economy and markets are soaring? Consider the following three points.
First, it’s important to understand how quickly the overall economy has recovered. Last week’s GDP report showed that the economy grew by an annual pace of 6.4% in the first quarter. (see below) Not only is this well above the historical average of around 2%, it also follows stellar growth rates of 33.4% and 4.3% in Q3 and Q4 2020, respectively. At this point, real economic activity is less than one percent below its pre-pandemic level. Many other data, from manufacturing activity to retail sales, are near once-in-a-lifetime levels.
In many ways, resurgent growth should not be surprising. Even during last year’s lockdowns, factories and equipment were still in working order, employees maintained their training and skills, and those businesses with strong balance sheets were able to reopen quickly. Businesses in some industries were either unaffected or were positioned to thrive.
Economists often refer to this type of rebound as “transition dynamics” – i.e., the economy accelerating to catch up after a crisis, made possible because the productive capacity of the country was still intact. This is in stark contrast to the 2008 global financial crisis when much of the business activity leading up to it became less valuable overnight.
Thus, the second factor for investors to consider is that policymakers learned in 2008 that fiscal and monetary stimulus could play significant roles during the early stages of recoveries. After all, supporting households can be important when the contribution of consumer spending to GDP has only grown over the past two decades, outpacing both business investment and government spending in relative terms. The fact that the financial crisis and the pandemic differ significantly hasn’t affected the policy playbook. Supporting those sectors and individuals that are still struggling is one reason Congress and the Fed continue to provide economic stimulus and keep interest rates low.
Long Term Effects
Of course, the long-term effects of such freely flowing money is controversial, especially when it comes to its impact on inflation. At the moment, there is evidence of rising inflation in certain areas, especially among economically important commodities, as well as overall prices coming off their pandemic lows. However, the long-term, runaway inflation that many fear has not been experienced in the U.S. since the early 1980s since technology and globalization tend to make goods and services cheaper. This doesn’t mean that sustainably higher inflation isn’t possible, but that these forces would need to either reverse or be overcome.
Finally, and perhaps most importantly for investors in this environment, the economy and markets are connected but only loosely so. They often appear to be tied together by a bungee cord – the market can move further and faster than the economy for a time, but one or the other will eventually need to adjust. In hindsight, the market will seem either rational or irrational based on whether the economy catches up, as it has successfully done over the past year.
For long-term investors, it’s more important than ever to stay disciplined and to stick to well-considered financial plans. Below are three charts that help to put today’s historic economic growth in perspective.
1 The economy has nearly returned to pre-pandemic levels
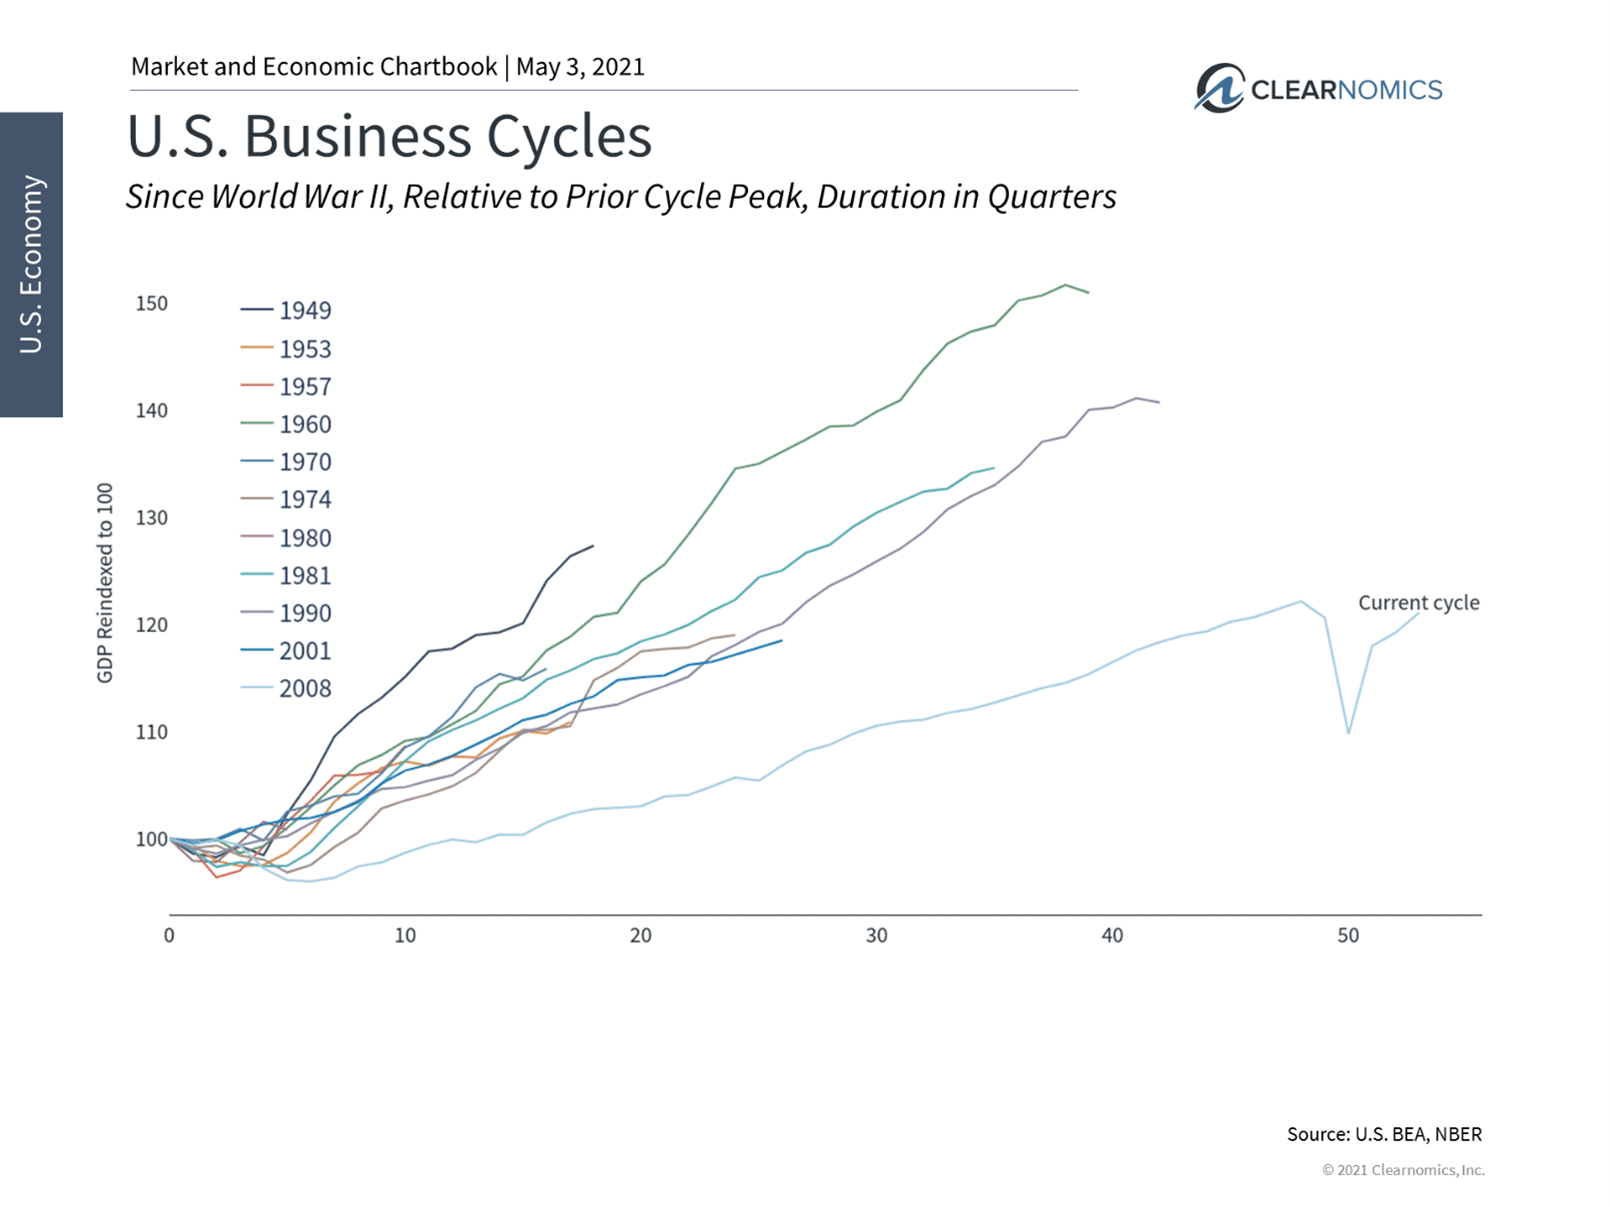
GDP grew by 6.4% in the first quarter compared to the final quarter of 2020. This is one of the fastest growth rates in decades and puts the level of activity within less than a percent of its pre-pandemic level. Although the National Bureau of Economic Research has not yet declared an end to the recession, there have now been three consecutive strong quarters of growth.
2 Consumption spending is even more important today
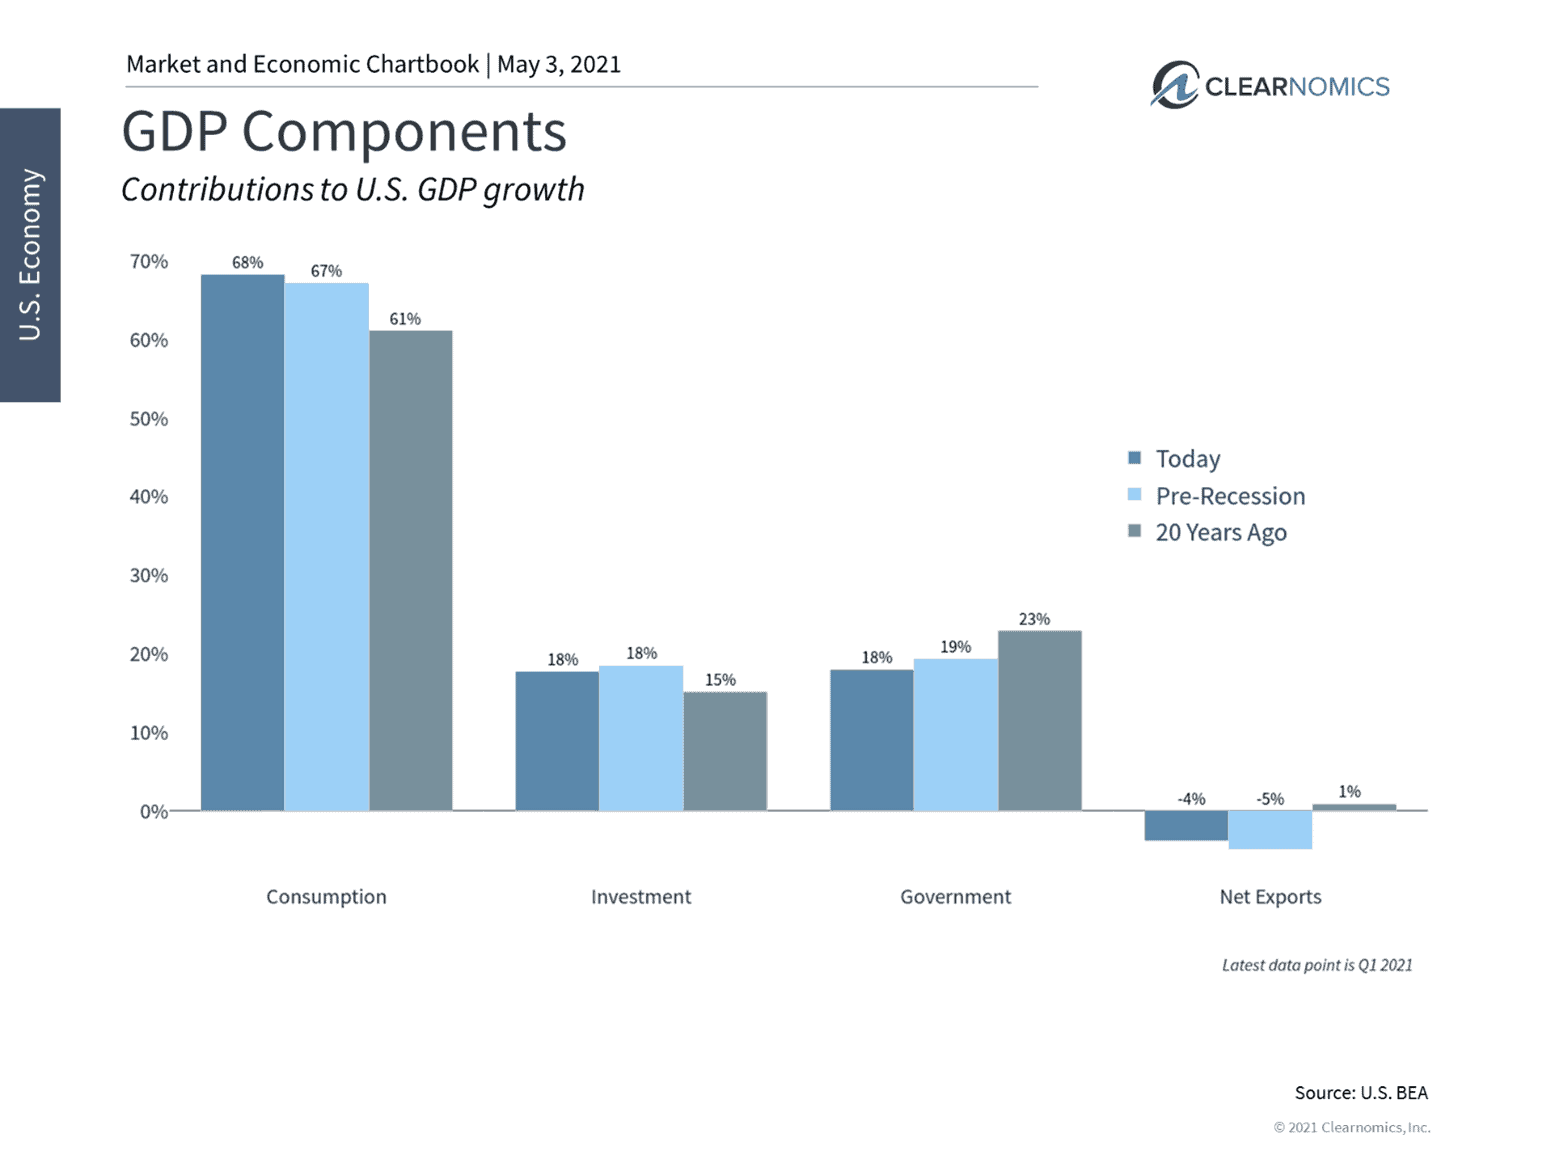
One reason both Congress and the Fed continue to provide economic stimulus, via government spending and low interest rates, respectively, is that some sectors and individuals are still struggling despite the overall economic boom. The chart above shows the make-up of economic activity today and in the past. Consumption spending by households and individuals has only grown relative to business investment and government spending.
3 Inflation fears linger as the labor market improves
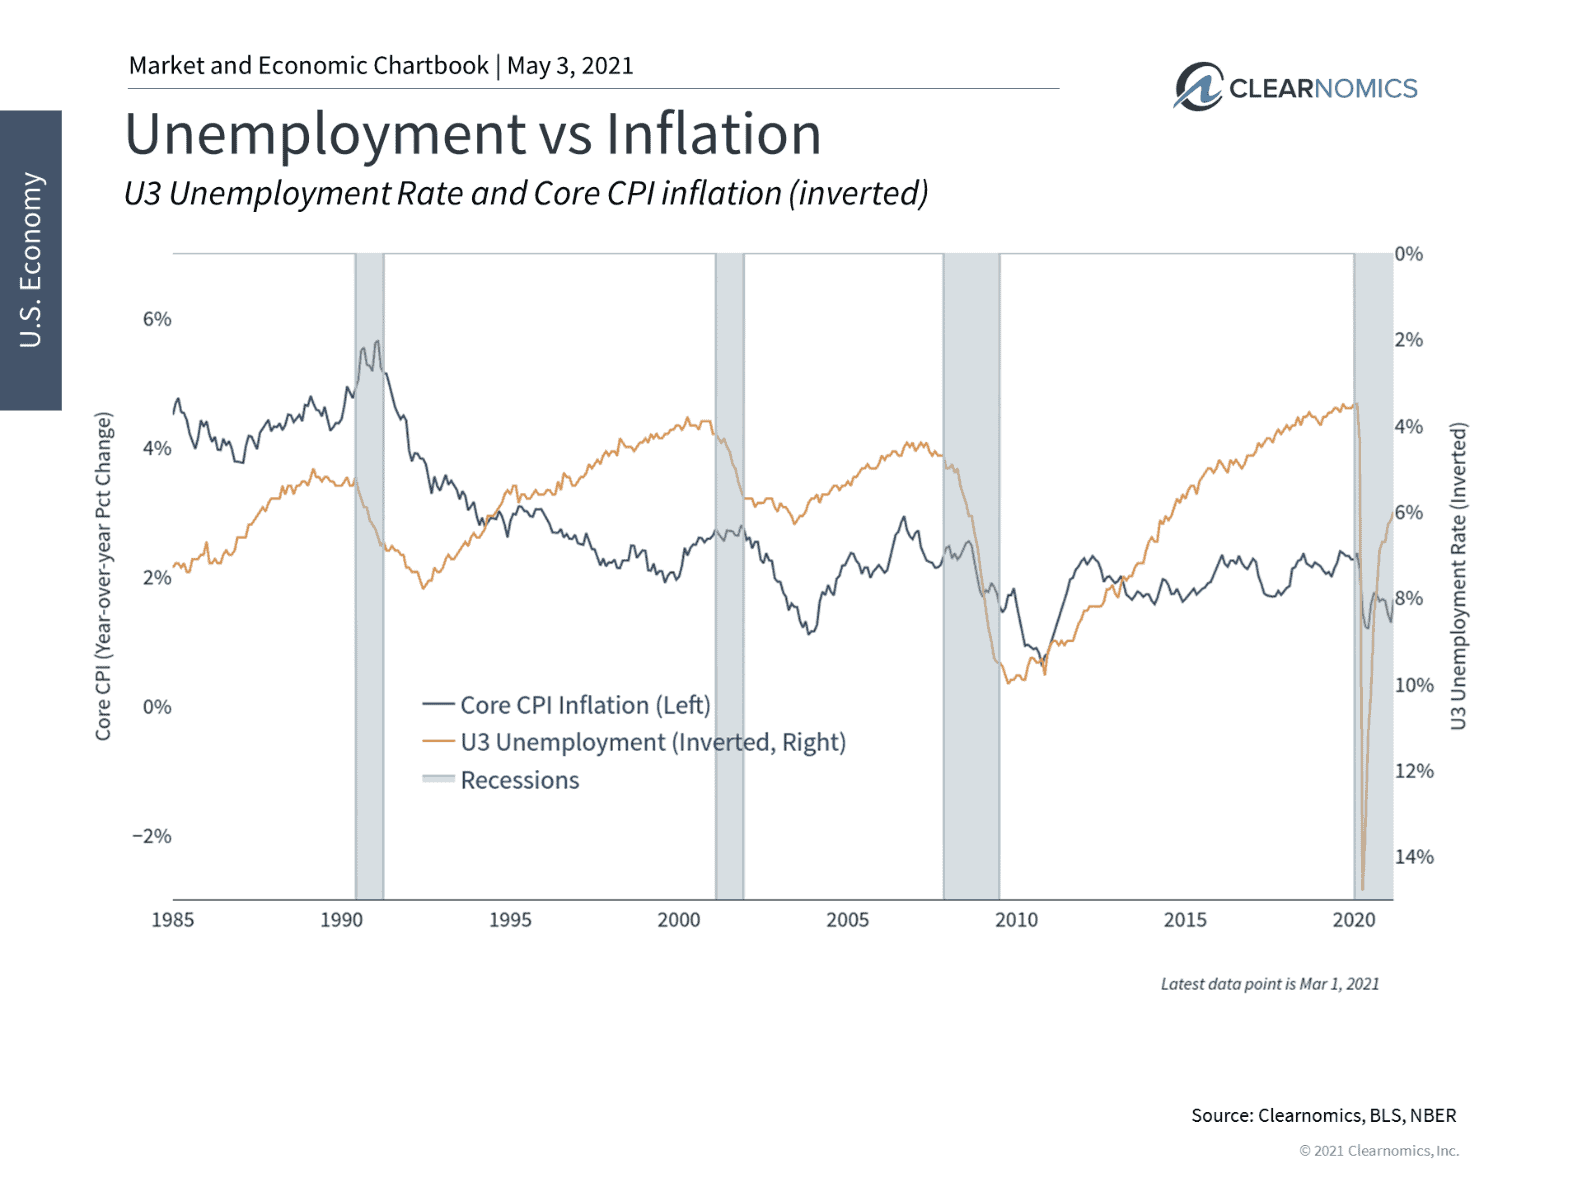
Although recent inflation statistics, such as CPI at 2.6% and PCE at 2.3%, are only somewhat higher, some economists and investors worry about the long-term consequences of government stimulus. Over the past forty years, however, inflation has tended to stall out during the business cycle even as unemployment continues to fall.
The bottom line? “Sell in May and go away” is not a myth, maxim, truth or a rule of thumb, just a rule of averages, like flipping a coin. The economy is growing rapidly, justifying the enthusiasm in the stock market over the past year. However, investors ought to stay disciplined and tactically diversified as valuations remain near record highs.
For more information on our firm or to get in touch with Jon Ulin, CFP®, please call us at (561) 210-7887 or email jon.ulin@ulinwealth.com. Get Started Today.
* “Sell in May and go away” began in England originally as “sell in May and go away until St. Leger’s Day.” The saying was based around the St. Leger Stakes, a popular horse race in September that marked the end of summer and a return of the big traders and market volume.
You cannot invest directly in an index. Past performance is no guarantee of future returns. Diversification does not ensure a profit or guarantee against loss.
The information given herein is taken from sources that IFP Advisors, LLC, dba Independent Financial Partners (IFP), IFP Securities LLC, dba Independent Financial Partners (IFP), and its advisors believe to be reliable, but it is not guaranteed by us as to accuracy or completeness. This is for informational purposes only and in no event should be construed as an offer to sell or solicitation of an offer to buy any securities or products. Please consult your tax and/or legal advisor before implementing any tax and/or legal related strategies mentioned in this publication as IFP does not provide tax and/or legal advice. Opinions expressed are subject to change without notice and do not take into account the particular investment objectives, financial situation, or needs of individual investors. This report may not be reproduced, distributed, or published by any person for any purpose without Ulin & Co. Wealth Management’s or IFP’s express prior written consent.


