No Acrophobia for Retirement Investors From Market Highs
Since the current bull market incepted October 2022 through the nail biter correction last October, many investors are wondering how long this economic cycle may last despite a multitude of headwinds, two wars and lingering inflation. Should you be afraid of heights as a long-term retirement investor? The short answer is no.
Acrophobia is an extreme or irrational fear or phobia of heights. It belongs to a category of specific phobias, called space and motion discomfort. Acrophobia sometimes develops in response to a traumatic experience involving heights, such as: falling from a high place or watching someone else fall from a high place. For some, this may bring back PTSD recollections of the 2000 and 2008 market heights and subsequent stomach- wrenching plunges.
Jon here. This is especially true for retirement age investors in their 60’s and 70’s, having survived from the dotcom crash to the great recession, a period otherwise known as the “decade to forget,” which was also my first decade in business. Back then in their 40’s and 50’s, as Mick Jagger would agree, boomers still had time on their side. Now, post the pandemic crash, the stakes are even higher for those in or nearing retirement.
History Rhymes and Repeats
Our retirement-aged clients understand that being too conservative in taxable cash vehicles may not help them significantly pay their bills nor keep up with inflation overtime, especially when the Fed starts cutting interest rates. To paraphrase Mark Twain, history rhymes and sometimes repeats. From 2008 through 2022 when the Fed Funds rate was near zero, retirees were forced to find other means of income and returns that were not cash weighted while delving more into stocks, annuities, and other alternative investments. Now may not be the best time to lock in a rate that will reset in a year or two.
At the same time, our clients understand that going too far into stocks and chasing returns like with ai/ tech stocks (FOMO) or reaching for high dividend investments or alternatives paying anywhere near 7%-10% annual yield, can get them in hot water. It’s critical for investors to focus both on the “return on their money” as well as the “return of their money” with every purchase. There is no such thing as a free lunch.
We remind our clients in every quarterly service meeting that the best elixir to market volatility while helping to meet their long-term goals is to stay diversified according to their financial plan, while avoiding short term market timing or making investment decisions based on emotions or headlines.
While it may seem counterintuitive, the markets continue to grind forward over time through new high highs. From 1928 through 2021, an average of 14 trading days per year have closed at an all-time high (Schwab). As the Fed is winding down their fight against inflation, there potentially should be more market highs as rates are eventually cut short term rates (Fed funds rate). Just so far this year, the S&P 500 has climbed to over 20 new highs after a historically strong start to the year. Bull market cycles last 4-5 years on average, and this market still has legs to run.
Looking Forward: Disinflation
Markets continue to be driven by artificial intelligence stocks led by the promise of generative ai, and the timing of the Fed’s first rate cut. Beyond the day-to-day swings, these drivers reflect important trends in innovation, productivity, and the health of the economy. They are also the result of the pandemic-era easy money policies and fiscal stimulus measures that led to booms in the tech sector and rapid price increases. As the dust settles on the inflationary episode of the past few years, consider the following points to maintain perspective.
Inflation is improving, albeit at a slower pace
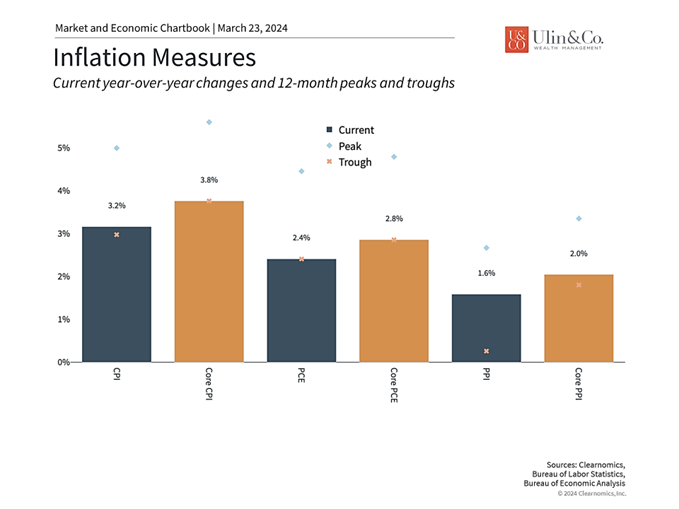
While economists and historians will no doubt spend the next decade documenting the many causes and policy decisions that drove the worst inflation in 40 years, it’s good to see the various supply and demand shocks are fading. Some prices remain stubborn, such as those for the important category of shelter which is near 40% of CPI (rent and mortgages), but most measures have improved significantly giving the Fed room to cut rates later this year.
The latest CPI report indicated that prices rose 3.2% on a year-over-year basis in February. (see chart) This represents a slight uptick from the prior month due to an increase in energy prices. Energy drove the Producer Price Index higher as well, although both the headline and core measures are both still at or below 2%. Core CPI came in at 3.8% but excluding the shelter component results in a year-over-year growth rate of only 2.2%.
These data points are consistent with consumer price inflation that is heading back toward 2%, although it will take some time. In any case, these figures represent the best-case scenario that investors could have hoped for less than two years ago. Still, the Fed has been a bit hawkish in their actions and dialog. This is wise since headline inflation is strongly correlated with energy prices that could easily get tipped off if conflicts escalate with Iran and or Russia.
Although many parallels have been drawn to the inflationary shocks of the 1970s and early 1980s, the policy response and economic outcome could not be more different. In the 1970s, the Fed switched direction multiple times as it grappled with the concept of “stagflation,” or the idea that inflation could rise even as demand was weak. Fortunately, perhaps because that period was studied so extensively by current policymakers, stagflation has been avoided this time around.
The money supply has stabilized
Perhaps most relevant for investors today is that disinflation then made way for “the Great Moderation” beginning in the mid-1980s. During this time, business cycles grew longer, inflation was subdued, unemployment fell, and markets performed well. While this is only one historical example, it does suggest that falling inflation and a return to more normal monetary policy will likely be positive for the economy and markets.
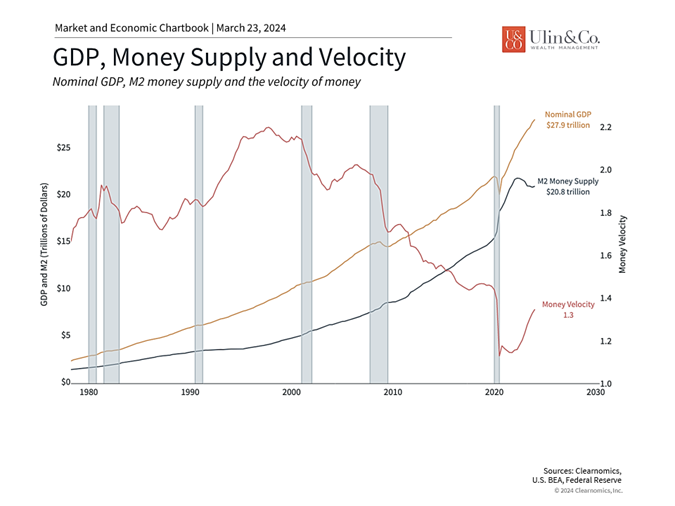
One concern among investors has been the supply of money, reflecting the famous quote by the economist Milton Friedman that “inflation is always and everywhere a monetary phenomenon, in the sense that it is and can be produced only by a more rapid increase in the quantity of money than in output.” Whether or not this view, known as “monetarism,” is right is a subject of debate among economists. Either way, the accompanying chart shows that the money supply has shrunk relative to its post-pandemic peak. This reflects monetary tightening by the Fed, including the shrinking of the Fed’s balance sheet at a pace of around $1.1 trillion per year.
Markets expect the first rate cut to occur in the summer
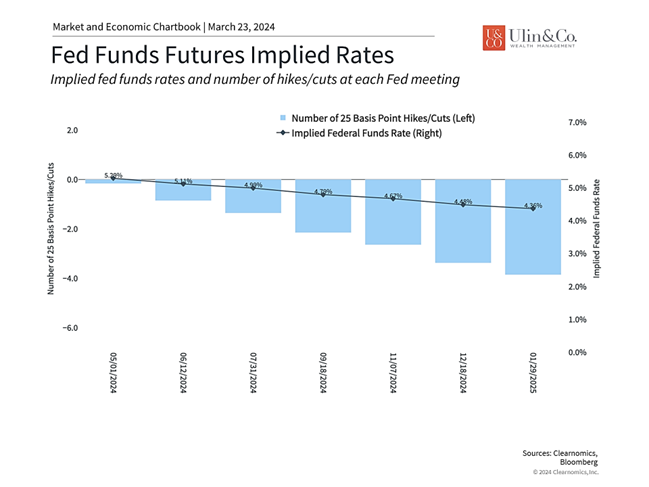
Thus, daily market swings continue to be driven by changing expectations for the economy and Fed rate cuts. Recent volatility has been the result of the market shifting to a first cut occurring in June or July rather than in March. (see chart) For long-term investors, whether this takes place today or a few months out (or longer) should be immaterial given the broader historical context. What matters is the underlying trend of improving inflation and steady economic growth. A return to more normal monetary policy should also help interest rates to stabilize, resulting in a more attractive financial market environment.
The bottom line? Retirement Investors should continue to focus on broad economic trends and historical perspectives through continued market highs rather than on day-to-day market swings and ominous headlines.
For more information on our firm or to request a complementary investment and retirement check-up with Jon W. Ulin, CFP®, please call us at (561) 210-7887 or email jon.ulin@ulinwealth.com.
Note: Diversification does not ensure a profit or guarantee against loss. You cannot invest directly in an index.
Information provided on tax and estate planning is not intended to be a substitute for specific individualized tax or legal advice. We suggest that you discuss your specific situation with a qualified tax or legal advisor.
You cannot invest directly in an index. Past performance is no guarantee of future returns. Diversification does not ensure a profit or guarantee against loss. All examples and charts shown are hypothetical used for illustrative purposes only and do not represent any actual investment. The information given herein is taken from sources that IFP Advisors, LLC, dba Independent Financial Partners (IFP), and it advisors believe to be reliable, but it is not guaranteed by us as to accuracy or completeness. This is for informational purposes only and in no event should be construed as an offer to sell or solicitation of an offer to buy any securities or products. Please consult your tax and/or legal advisor before implementing any tax and/or legal related strategies mentioned in this publication as IFP does not provide tax and/or legal advice. Opinions expressed are subject to change without notice and do not take into account the particular investment objectives, financial situation, or needs of individual investors.


