Gov Spending Propels Debt Clock Time Machine
Investors’ concerns and fears eased a bit this week as the consumer price index (CPI) remarkably came in less than expected at 8.5% for July and below the 9.1% reading from June as inflation pressures eased a bit mainly due to tumbling energy and gas prices.
The US stock market put up one of the worst first-half performances this year followed by one of the best months in history for July at 9.11% for the S&P 500 index bringing its YTD return to -13.34%. While there may be cynics next week discussing this recent rally may be a temporary reprise or a dead-cat-bounce, consider that It’s not a question of will we see a comeback into a new bull market, but when.
Make no mistake that inflation is still burning hot, there’s no end in sight to the Russia/ Ukraine war or the pandemic variants, and we are not out of the bear- woods just yet. While there are positive economic indicators helping to lead stocks and the economy to better times, some of the financial repercussions of COVID19 may come back to haunt us.
Wringing out Cash
Should you be concerned that the US government is back at it printing billions of dollars while adding to the US debt as rates are rising? The short answer is to keep an eye on it. Just the interest payments on the national debt total $378 billion for FY 2021. Mandatory spending on social benefits is skyrocketing as more boomers reach retirement age. By 2030, one in five Americans will be older than 65. By 2034 costs are predicted to outweigh interest and income for Social Security. Just the same, as citizens, voters and taxpayers, there is no more important task than helping to shape policy that benefits future generations.
While there are still lessons to be learned from the aggressive response by the US government to the COVID19 pandemic and resulting financial crisis, the near $7 Trillion dollar cash infusion between the 2020 CARES Act and the 2021 American Rescue Plan may have contributed near 4% to the current 8.5% CPI rate while elevating the national debt to over $30.6 Trillion dollars. While the US government did a bit more than patch a big hazardous hole left by the man-made quarantine crash of 2020, the cash-spigot may have been left open a wee-bit too much.
The Fed is aggressively hiking the Fed Funds rate to help cool off the economy by working to increase prices, thereby “wringing-out” excess cash from the system in addition to shrinking its balance sheet by $95 billion per month from September on, accelerating “quantitative tightening,” which started in June. This has also indirectly strengthened the dollar which is also helping to curb inflation.
Now just after passing the $1.2 Trillion dollar infrastructure bill last November, congress may soon deploy a $700 billion dollar package before midterms through the “Inflation Reduction Act” that is a diminished version of the Build Back Better Act. It stands to be the single largest investment in climate and energy in addition to drug pricing reforms and hiring near 87 thousand new IRS agents.
Nonpartisan experts from the Congressional Budget Office (CBO) to the Penn Wharton Budget Model studies indicate it will provide minimal downward pressure on inflation. Printing out billions of dollars more in cash may fuel inflation on top of looming issues that may derail employment to prices of goods with a planned new 15% minimum tax on large corporations.
The budget deficit remains large
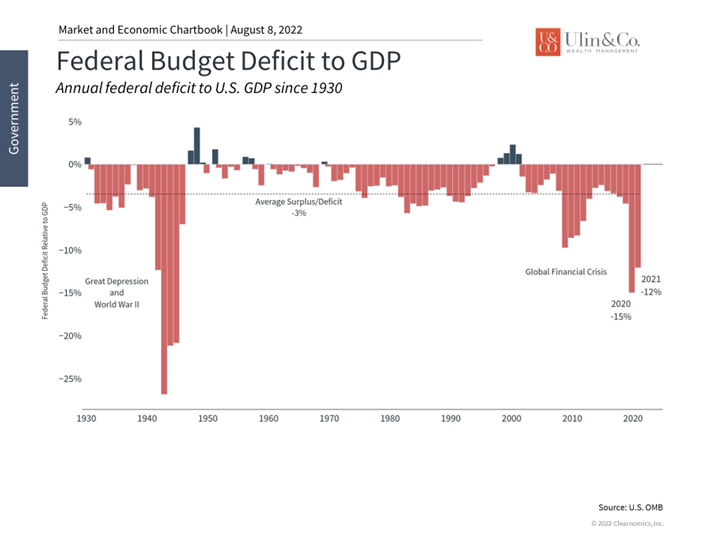
The large and ever-growing national debt as rates rise and interest payments increase is a controversial topic that impacts the economy and markets in complex ways and could lead to a future catastrophic black swan event. If you are seeking an ominous forecast, look no further than the US Debt Clock “time machine” website illustrating the current national debt stands at $30.6 Trillion while predicting it to be over $41 Trillion by 2026.
At its core, budget deficits occur when the government spends more than it collects in taxes and other sources of revenue, which adds to the total debt. Even though tax revenues tend to increase as the economy grows, they have been outpaced by spending over time. These expenditures have grown across “mandatory” programs such as Social Security and Medicare as well as “discretionary” items such as defense and education. The shortfall is funded by government borrowing, i.e., by issuing Treasury securities.
During the pandemic, government spending ballooned to support the economy which added trillions of dollars to the national debt. This caused the deficit to spike to 15% of GDP in 2020 and 12% in 2021. With that spending behind us, the Congressional Budget Office (CBO) projects that the deficit will improve to 3.9% of GDP in 2022.
However, the CBO also projects that the annual deficit will average 10% of GDP 20 years from now, in the 2043 to 2052 timeframe. By 2052, they project that net interest payments alone will rise to 7.2% of GDP. Thus, a common concern among investors is how this will impact the country’s ability to finance itself and how it might affect the economy. In its report, the CBO acknowledges and explores possibilities such as the federal government crowding out private investment, rising interest costs driving up interest payments to foreign Treasury holders, and more. Beyond these factors the report examines the potential risk of a major fiscal crises, the erosion of confidence in the ability for the federal government to pay off its debts, and constraints on policymakers to implement policy.
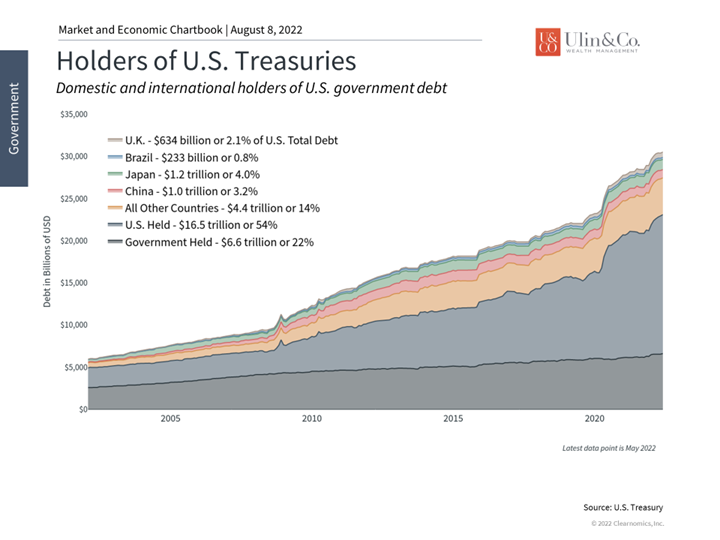
Treasury securities are still primarily held by U.S. entities
All of this may come across as a lot of gloom and doom, especially for those who have worried about such issues for decades. However, it’s important to distinguish between what matters as citizens, voters and taxpayers, and what matters as long-term investors. As individuals, many have strong personal and political views on government spending and taxation, and what it may mean for the country over the coming generations. However, this can be distinct from whether deficits directly or indirectly impact the economy and markets, and more importantly, investment portfolios.
For example, even after the trillions of pandemic spending, about two-thirds of the national debt is held either by the U.S. government itself or by U.S. citizens. And while it’s true that rising deficits could make Treasuries less attractive in the future, hampering the government’s ability to roll its debt, there have not been signs of it yet. Even in 2011, when Standard & Poor’s downgraded the U.S. debt during the fiscal cliff standoff, investors didn’t sell their Treasuries – they rushed to buy more. Ironically, this is because U.S. debt securities are still the standard for stable, risk-free assets in the world.
Perhaps most importantly, markets have done well regardless of the exact level of government debt and taxes over the past century. As unintuitive as it might seem, the best time to invest over the past two decades has been when the deficit has been the worst. These periods represent times of economic crisis when the government is engaging in emergency spending, which tends to coincide with the worst points of the market. And while this may not be the most repeatable investment strategy, it does underscore the importance of not over-reacting to fiscal policy in one’s portfolio.
The bottom line? There are growing concerns as government spending adds to the US debt and interest rates rise. As citizens, voters and taxpayers, there is no more important task than helping to shape policy that benefits future generations. But as investors, it’s important to remember that markets can do well in a variety of environments. The market rebound of the past two months is a reminder to stay patient and invested.
For more information on our firm or to get in touch with Jon Ulin, CFP®, please call us at (561) 210-7887 or email jon.ulin@ulinwealth.com.
You cannot invest directly in an index. Past performance is no guarantee of future returns. Diversification does not ensure a profit or guarantee against loss. All examples and charts shown are hypothetical used for illustrative purposes only and do not represent any actual investment. The information given herein is taken from sources that IFP Advisors, LLC, dba Independent Financial Partners (IFP), and it advisors believe to be reliable, but it is not guaranteed by us as to accuracy or completeness. This is for informational purposes only and in no event should be construed as an offer to sell or solicitation of an offer to buy any securities or products. Please consult your tax and/or legal advisor before implementing any tax and/or legal related strategies mentioned in this publication as IFP does not provide tax and/or legal advice. Opinions expressed are subject to change without notice and do not take into account the particular investment objectives, financial situation, or needs of individual investors.


