Don’t Get Spooked by the Fed Fighting Inflation
Just ahead there may be more treats than tricks ahead for investors despite peaking inflation, a hawkish Fed, war and the upcoming midterms. The Halloween Indicator is a market timing strategy based on the hypothesis that stocks perform better from Oct. 31st (Halloween) to May 1st than they do from the beginning of May through the end of October six month period.
Some who subscribe to this myth say not to invest at all during the summer months. The name likely came about because this pattern emerges right after Halloween. It is the opposite of the well-known market adage of sell in May and go away. Its longer version was some variation of these words: “Sell in May, go away, come again St. Leger Day,” with origins from the UK.
While we do not promote seasonal market timing or invest based on superstitions, this stock market anomaly dating back to at least the 1930s does have some merit. For 26 years leading up to 2017, studies have shown that the return in months from November to April totaled near 6.8%. In contrast, the returns for the six months after May are a mere 2.1%. This indicator is fascinating for the reason that it is an empirical anomaly as well as a mystery.
History Rhymes
Jon here. Market timing is a fool’s game, as you never know what you may get. We actually look forward to spooky stock market corrections and crashes as “buying opportunities” no matter the season or facing down the next U.S. midterm election cycle on November 8th that will again get the country riled up.
History rhymes and at times repeats. More so than providing an opinion or prediction, analyzing current market and economic indicators and trends while looking back at past market cycles can provide some good insight.
Considering that we do not appear to be experiencing a great recession, on average, most average bear markets last 388 days — or just over one year with a downside low near 34% which may indicate we may be near 70% through the current bear market. As inflation subsides, we may see stocks pick up speed more so than the severity and length of the Dotcom and credit crisis crashes.
The Fed Fighting Inflation
Whether the Fed can regain control of inflation while keeping the economy steady continues to be the central question for investors and economists. Since inflation data is only released monthly, GDP data quarterly, and the Fed only meets once every six weeks, it could be some time before this question is fully answered.
The recent Consumer Price Index (CPI) report showed that while inflation is improving in some areas including energy and used cars, it is broadening in important categories such as shelter, transportation services, and medical care. Core inflation, which excludes food and energy, has increased 6.6% over the past year.
These data all but guarantee that the Fed will continue to raise rates quickly. Current market expectations are for the Fed to increase rates 0.75% in November and again in December, reaching a fed funds rate of 4.5% by year end. To put this in perspective, the fed funds rate was zero percent as recently as March. This is like slamming on the accelerator in an F1 race car, hoping not to fish tail leading to a fiery crash into the stands.
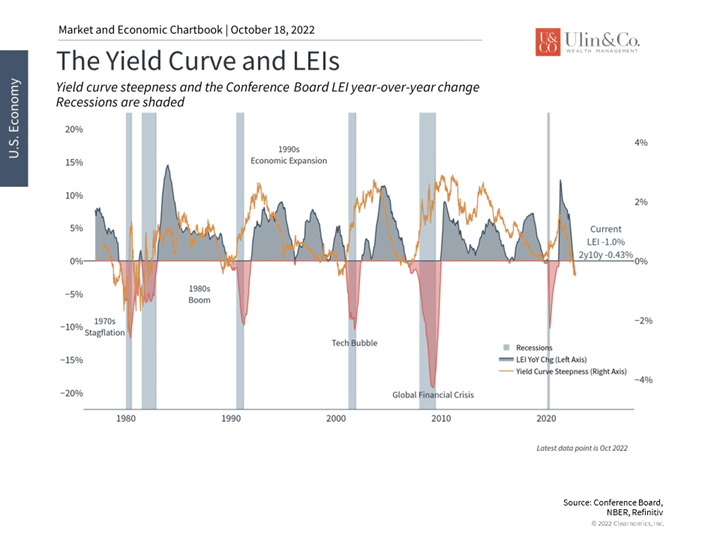
Economic indicators point to a slowdown

For this reason, many investors continue to worry about a so-called “hard landing,” a scenario in which the Fed must induce a recession in order to regain control over inflation. Many on Wall Street are predicting that there could be a recession over the next year as a result.
However, it’s important to distinguish between the many things investors mean when they say “recession.” A casual definition involves two negative quarters of GDP growth. This has already occurred with the first and second quarters of the year experiencing GDP declines of 1.6% and 0.6%, respectively. A more official definition would involve a challenging downturn, one in which unemployment rises. This is what the Fed already expects based on their latest economic projections which show unemployment rising to 4.4% by the end of next year.
Regardless of which scenario plays out, it’s important to maintain some perspective. While none of these situations is positive, they are still quite different than what occurred during the initial stages of the pandemic, when GDP fell 30% at an annualized rate, or during 2008 when the financial system was on the brink of collapse. Historically, recessions occur periodically and are important since they allow for an “economic reset,” paving the way for future growth.
The money supply is no longer expanding

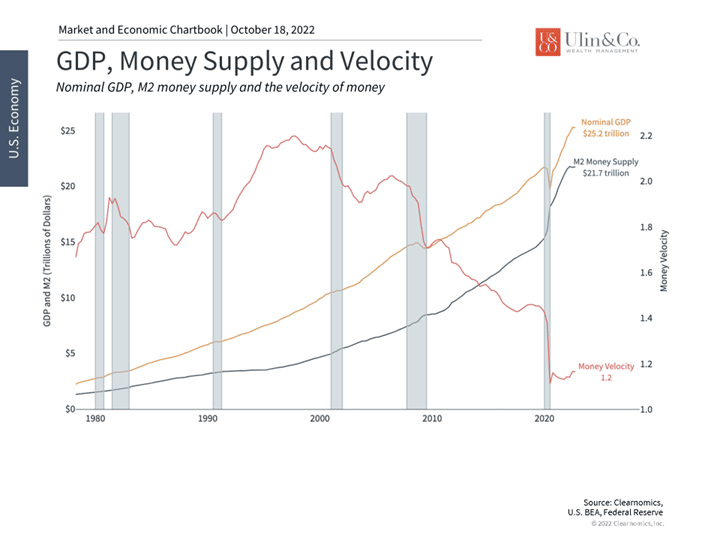
The velocity of money is a measurement of the rate at which money is exchanged in an economy. It is the number of times that money moves from one entity to another. It also refers to how much a unit of currency is used in a given period of time. Simply put, it’s the rate at which consumers and businesses in an economy collectively spend money.
The velocity of money is usually measured as a ratio of gross domestic product (GDP) to a country’s M1 or M2 money supply. The natural question is how far the Fed will have to raise rates this time. The Fed’s actions can already be seen in measures of the money supply including M2 in the chart above.
The Taylor Rule
One popular framework, the “Taylor Rule,” helps policymakers understand the appropriate level of policy rates based on economic trends. There are many versions of these rules, all based on the idea that the Fed should raise rates if inflation or growth are higher than average. Higher rates bring inflation and growth back in line which then allows policymakers to lower rates again. Thus, while no central bank follows a monetary rule like this exactly, especially because the data can change over time and monetary policy acts with long lags, it can be a helpful tool.
What does the Taylor Rule tell us today? The current levels of inflation and economic output would imply a fed funds rate in the range of 7.5% to 12% depending on which version of the Taylor Rule is used. If this seems surprisingly high compared to the current fed funds rate of 3%, it’s only because inflation is so much higher than expected. Of course, the Fed will not adhere to the Taylor Rule exactly, but all of this points to the Fed continuing to raise rates through the rest of this year and into 2023.
Retirees will benefit from a sizable cost-of-living adjustment

Two Silver Linings to inflation
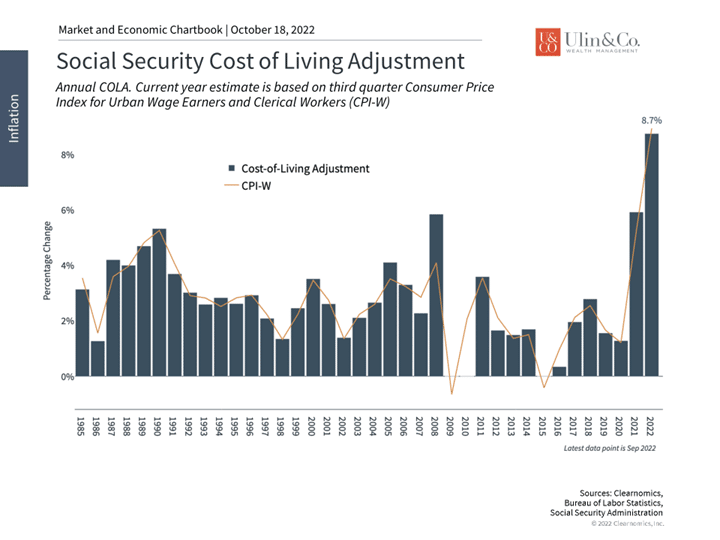
The first is that the Social Security Cost-of-Living Adjustment (COLA) for 2022 is officially the largest since the early 1980s. While this doesn’t necessarily make up for low COLA adjustments since 2009, it is positive for those collecting Social Security, nonetheless. This is especially true if some important prices actually decline since these adjustments will remain in place. For example, the fact that the national average gasoline price has fallen from $5 per gallon to around $3.90 is already positive.
The second is that market valuations are the most attractive in years, with the price-to-earnings ratio of the S&P 500 hovering around 16x. Investors should remember that long-term portfolio returns are often defined by decisions made in challenging times like these, and not when markets have already recovered. Those who overreact and shift to cash will not only miss the eventual market rebounds but will have the value of their cash eroded by inflation. While it’s easier said than done, having the discipline and patience to stay invested is often rewarded, just as it was during the 2009 and 2020 recoveries.
The bottom line? Investors should continue to expect rate hikes in response to the fed fighting inflation. Staying invested is still the best approach to benefit from attractive prices and valuations.
For more information on our firm or to get in touch with Jon Ulin, CFP®, please call us at (561) 210-7887 or email jon.ulin@ulinwealth.com.
You cannot invest directly in an index. Past performance is no guarantee of future returns. Diversification does not ensure a profit or guarantee against loss. All examples and charts shown are hypothetically used for illustrative purposes only and do not represent any actual investment.
The information given herein is taken from sources that IFP Advisors, LLC, dba Independent Financial Partners (IFP), IFP Securities LLC, dba Independent Financial Partners (IFP), and its advisors believe to be reliable, but it is not guaranteed by us as to accuracy or completeness. This is for informational purposes only and in no event should be construed as an offer to sell or solicitation of an offer to buy any securities or products. Please consult your tax and/or legal advisor before implementing any tax and/or legal related strategies mentioned in this publication as IFP does not provide tax and/or legal advice. Opinions expressed are subject to change without notice and do not take into account the particular investment
objectives, financial situation, or needs of individual investors. This report may not be reproduced, distributed, or published by any person for any purpose without IFP’s express prior written consent.


