Don’t Sell Stocks in May and Run Away – Running into a Recession
The month of May is notable for Cinco de Mayo, Earth Day, National Teachers Day and family celebrations on Mother’s Day. It is a month that culminates the transition from spring to the first day of summer as patterns in life and nature continue.
A bit more ominous, Mayday is an emergency procedure word used internationally as a distress signal in voice procedure radio communications. It derives from the French phrase “venez m’aider”, meaning “come help me”. Could this distress signal be a precursor for the popular stock market adage which warns investors to “Sell in May and go away?”
This popular market-maxim is heavily based on the concept of seasonality, specifically that stocks perform better in the winter months than they do in the summer. In such strategies, stocks are sold at the start of May, then are bought back again in the fall, typically around Halloween. This feat is also associated to the “Halloween Indicator” effect conducted by Ben Jacobsen, chairman in financial markets at the University of Edinburgh Business School, Scotland.
Seasonal Patterns (Summer, Fall, Winter, Spring)
While we are generally skeptical of calendar patterns like this, the S&P 500 has in fact gained +7% on average and risen +78.3% of the time during the six months ending in April (since 1950), versus a paltry +1.5% average gain during the six months ending in October while increasing only +64.3% of the time.
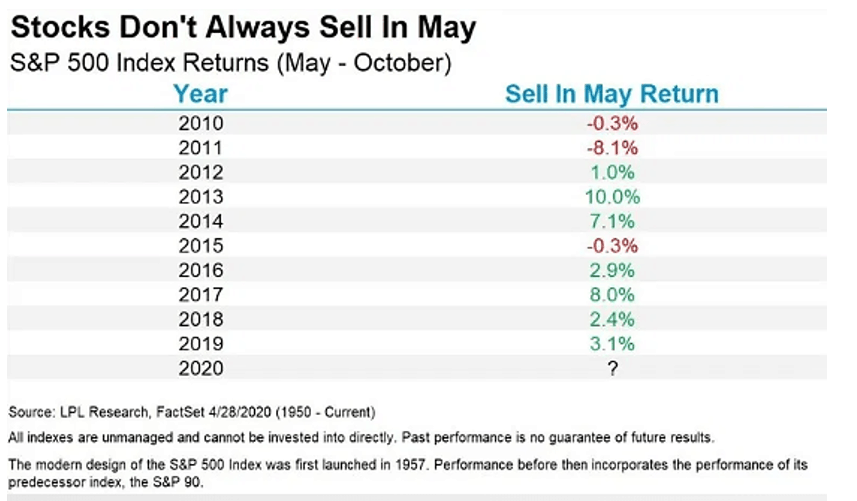
What this tells us, is that historically the summer months have been slower than the winter months, but you never know what you may get. In reality, “Sell in May” is not a myth, maxim, truth or a rule of thumb, just a rule of averages, like flipping a coin. While “April showers bring May flowers,” consider that in seven of the past eight years we have seen stocks bloom during the May-October “undesirable” summer- stretch (see below.)
Yet, after a swift partial rebound by the US markets in April, decelerating corporate earnings and snowballing unemployment numbers could trigger a more than a slight summer pullback, leading to the possibility of a “W” shaped recovery as we noted in our recent blog “Cat’s and Vision Charts, the Shape of Economic Recovery.”
On the flip side, we discussed during our recent Market Insights webinar with JP Morgan that the Fed’s trillions of dollars of monetary stimulus (unlimited Quant-easing, zero rates, corporate bailouts, Paycheck Protection Program (PPP) and stimulus checks) being pumped into the system (like filling in a huge six trillion ditch with dirt), along with a potentially positive outlook on the pandemic peaking and quarantine ending in the next couple of months, could shorten the length of the impending recession and provide forward momentum for stocks along with a faster than expected economic recovery.
Cyclical Patterns (Bulls & Bears)
Just like seasonal stock patterns and results, bull and bear markets are not created equal and do not operate on a set schedule like the earth revolving around the sun. The history of modern market and economic cycles suggests that while downturns may be sudden and deep, the subsequent expansions more than make up the difference.
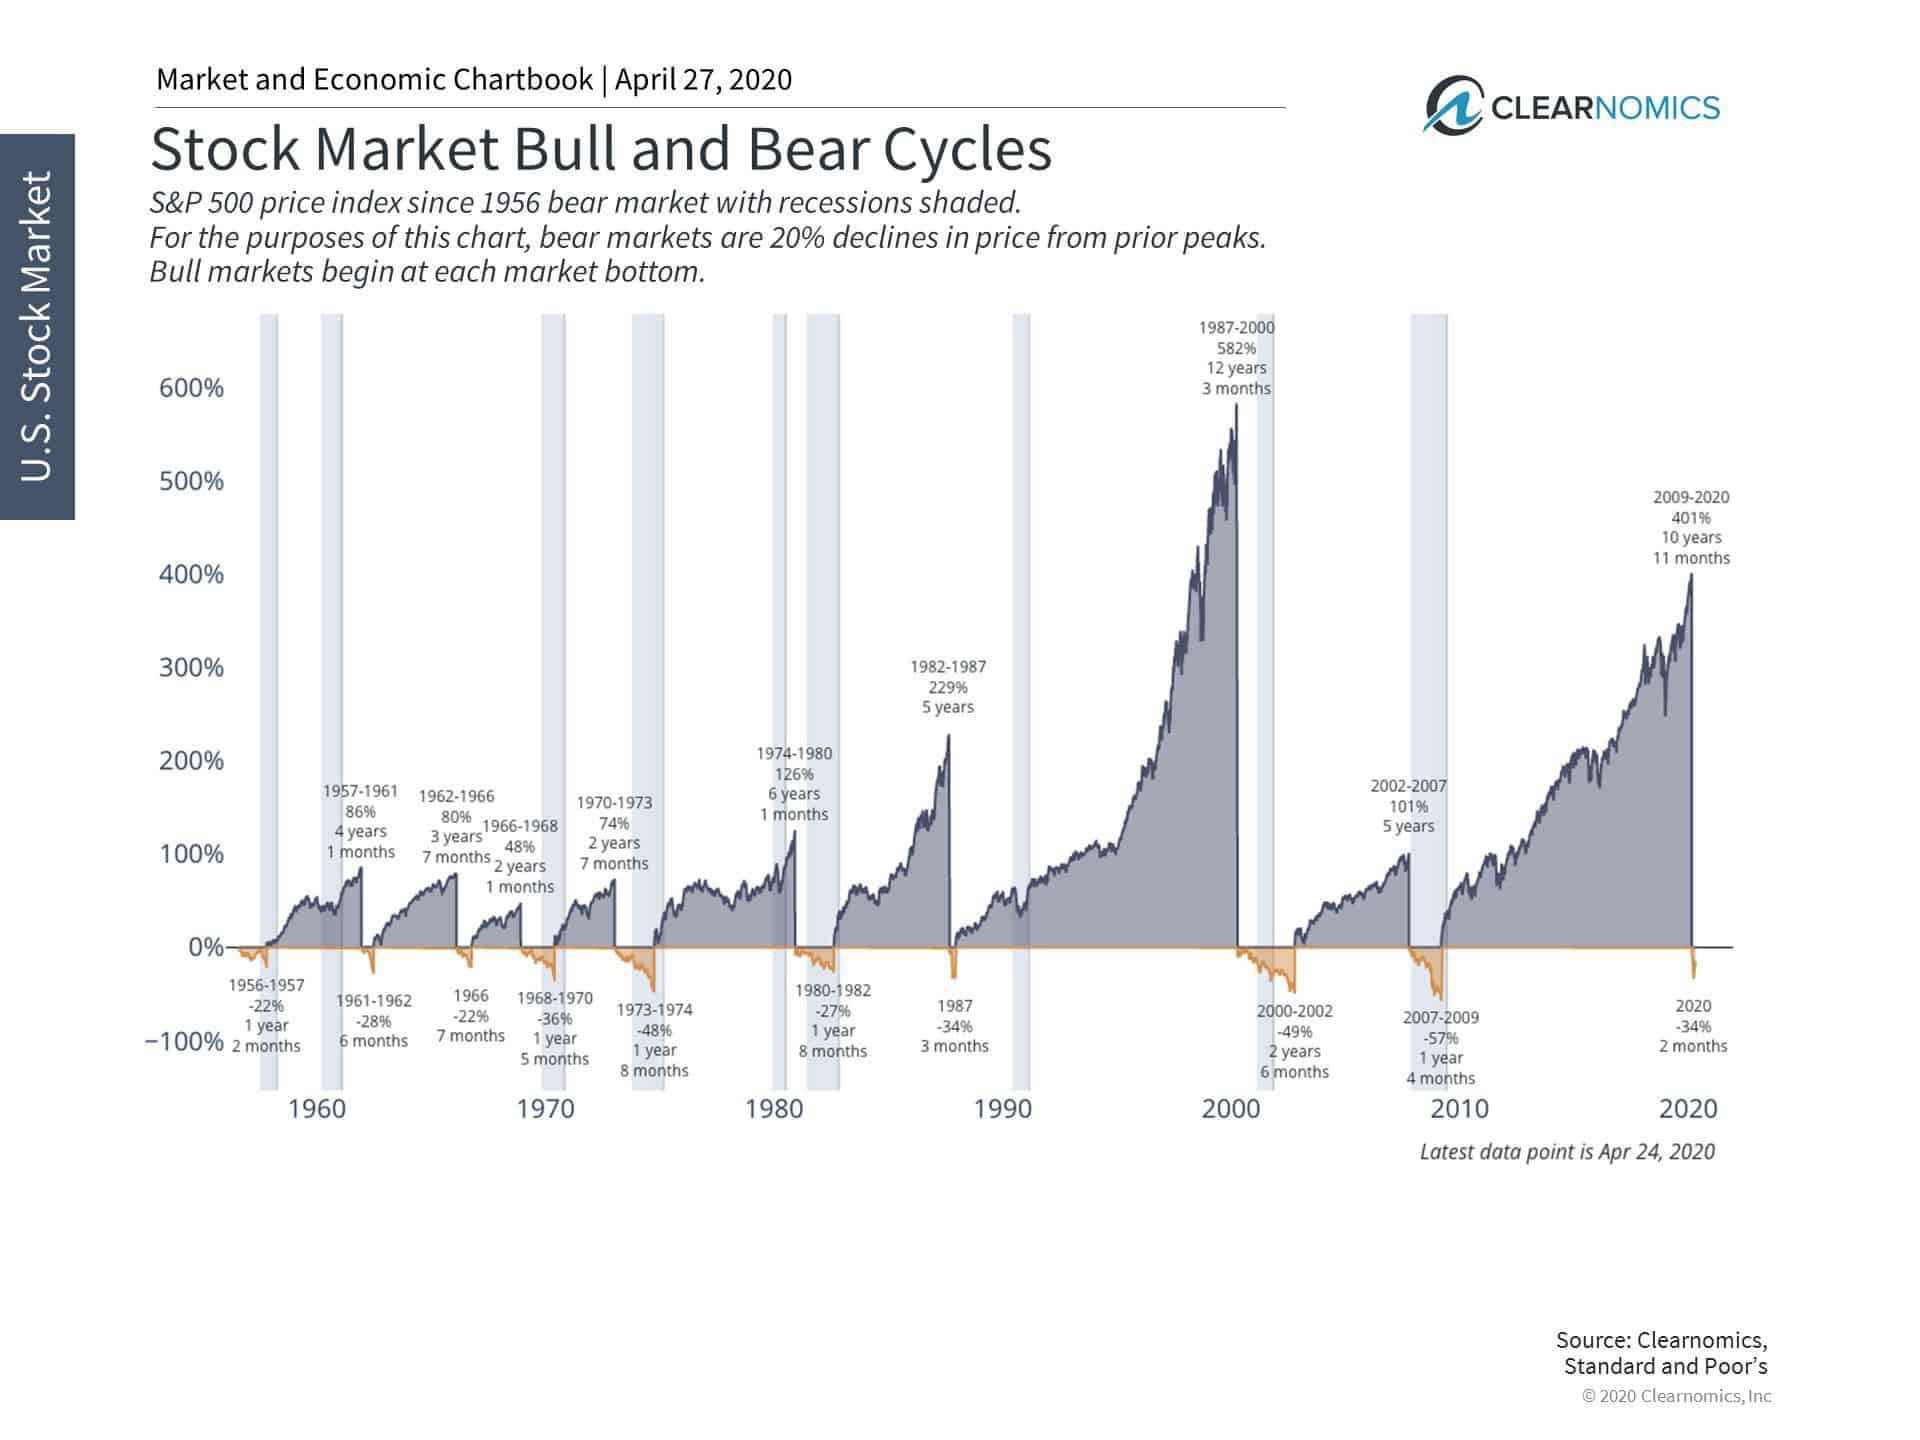
As the first chart below shows, bear markets since World War II have lasted anywhere from 6 months to two-and-a-half years. During these periods, the U.S. stock market has fallen anywhere from 22% (1957) to 57% (the 2008 financial crisis) at their worst points.
In contrast, bull markets have lasted from about 2 years to over a decade in length, with the two longest cycles occurring during the past 30 years. These cycles have seen the stock market multiply in value many times over. The nearly eleven-year bull market that ended in March experienced a price return of 401% and close to 530% with reinvested dividends.
Diversification is Key (Sunblock and Umbrellas)
Jon here. If seasons behaved like the bear and bull markets of recent decades, there would be beautiful weather 11 months out of the year. This is why its critical for long term investors to stay the course and not derail their money and plans in the short run.
Of course, past performance is no guarantee of future results, and the point is not that bear markets are insignificant. For those who live in colder climates, preparation is the key – but not at the expense of enjoying the summer months. Preparation when it comes to one’s portfolio means holding a balanced set of asset classes and focusing on longer-term trends. It’s like holding both umbrellas and sunblock in your travel bag as you never know what you may get.
What Lies Ahead
The trends relating to this bear market and the recession that is likely already occurring due to the coronavirus will depend on the on-going economic shutdown. Tens of millions of jobs have already been lost and stress is building for individuals, businesses and municipalities, especially in credit markets. Some of these job losses may be temporary depending on how quickly the economy reopens, but this is little consolation for those facing financial difficulties. The plateauing of COVID-19 cases in the U.S. and other countries returning to work are positive signs of potential green shoots over the next several months.
Thus, while there will undoubtedly be very poor economic data, increased stock market volatility, and challenging times ahead for people and companies alike, it’s important to see the bigger picture when it comes to investor portfolios. Below are three charts that help to put bull and bear markets in perspective.
- Bull and bear markets are a natural part of investing

Bull and bear markets are a natural and unavoidable part of investing. Not only are they difficult to predict, but each market cycle has its own unique circumstances. Despite this, historical bull markets tend to last much longer and generate much larger returns compared to bear market declines.
- Bear markets tend to turn around without notice and recover steadily

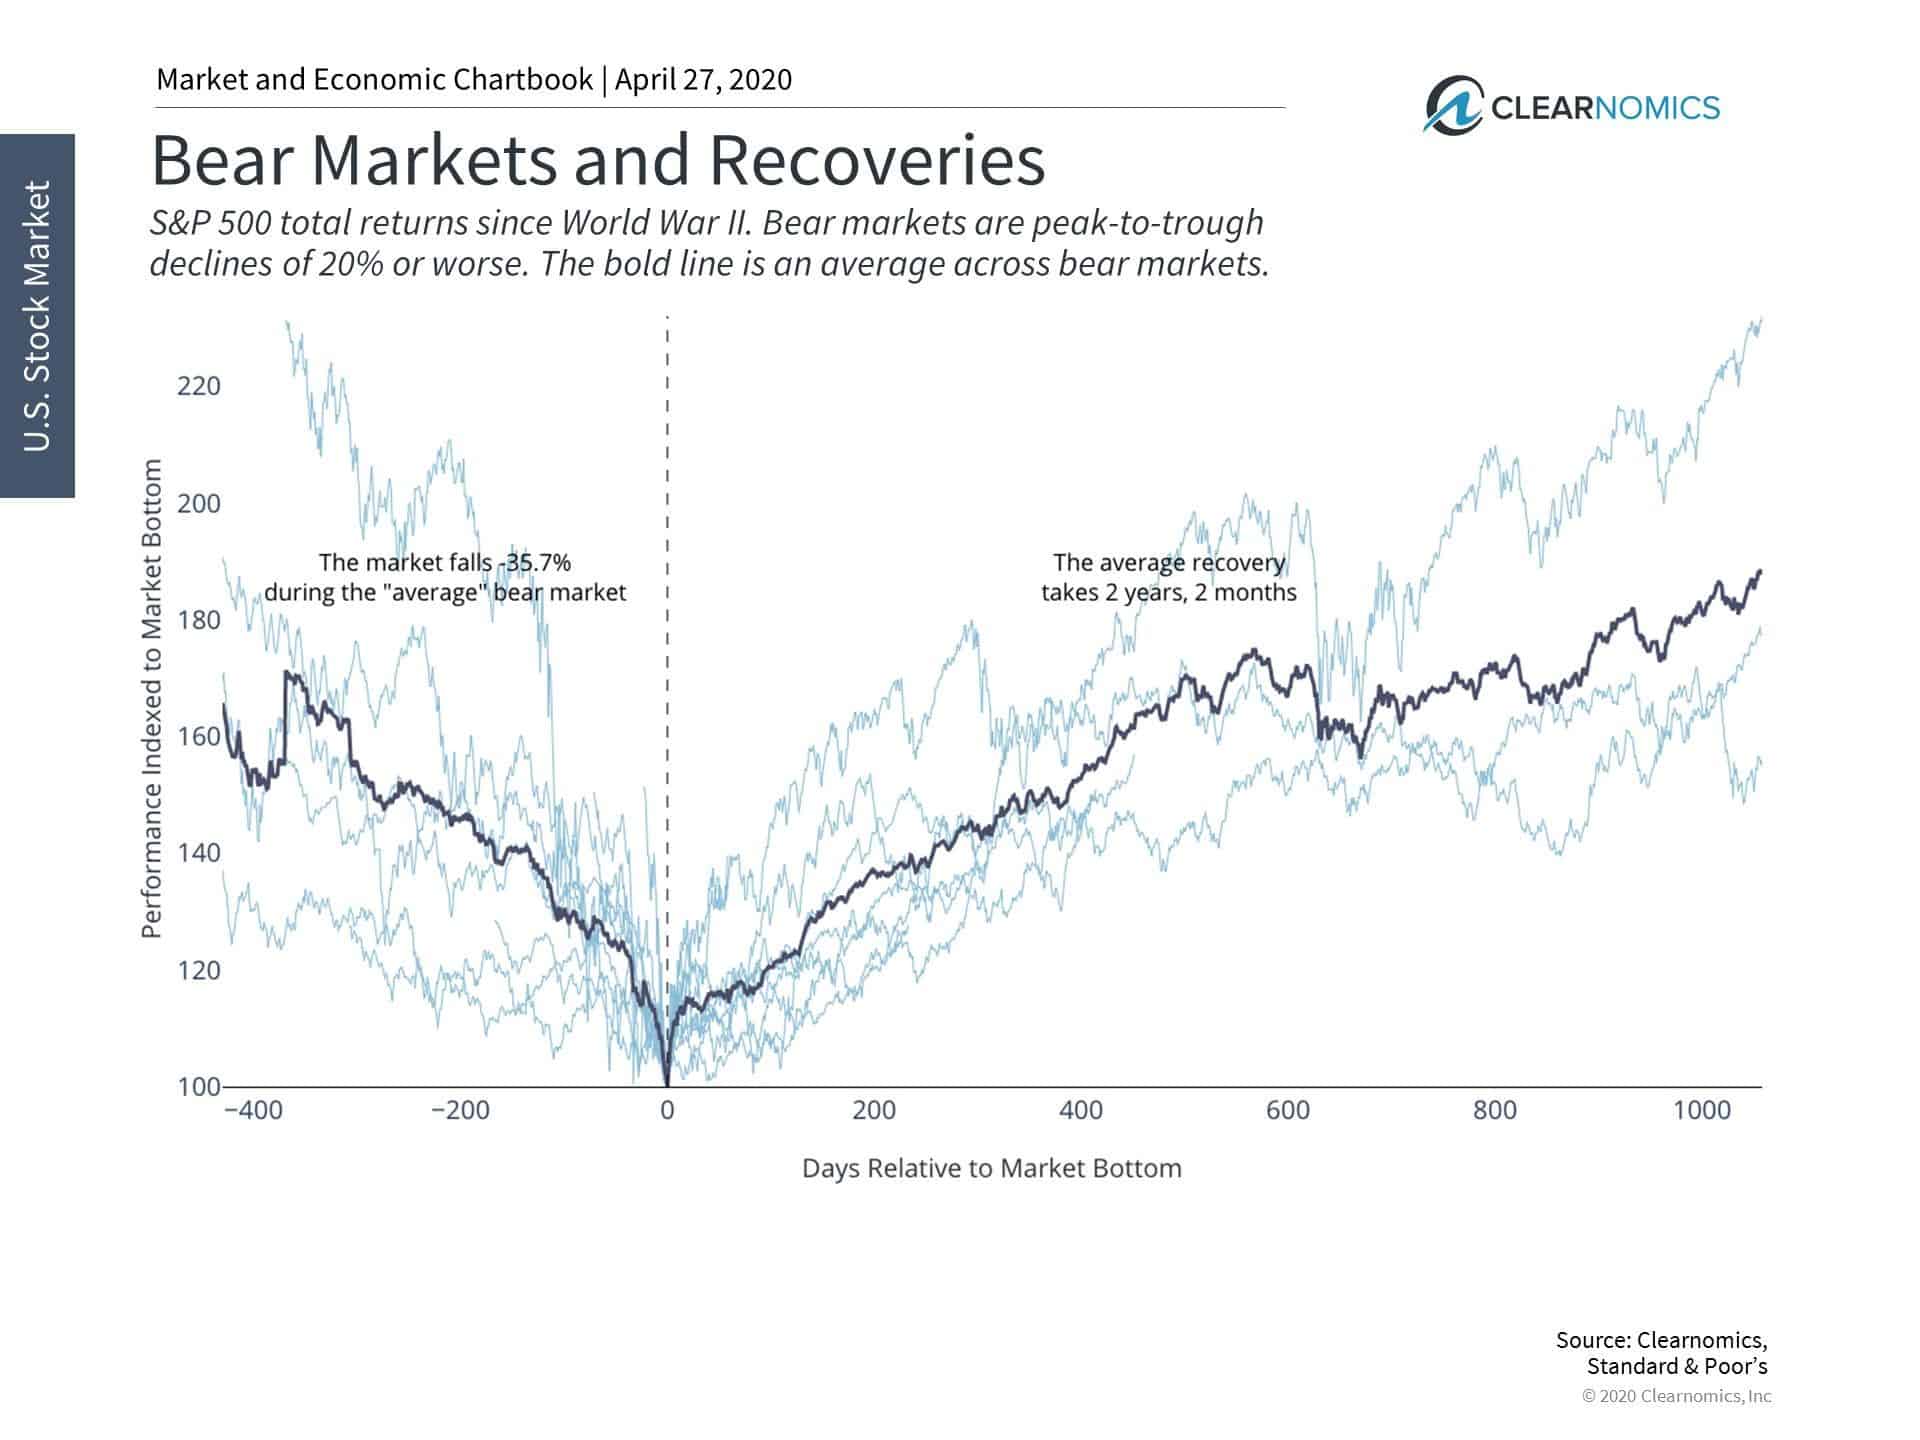
While bear market declines can be sudden and swift, recoveries tend to occur without notice. These subsequent bull markets then recover over years, with recent cycles lasting a decade or longer.
- Seasonal Patterns and Maxims Don’t Always Follow Course

While the stock market and the economy are not the same, they are very much related. This is because stock prices often fluctuate depending on economic performance via earnings, interest rates, credit spreads, and other factors. At the same time seasonal patterns and patterns between stock and the economy do not always hold true.
The bottom line? Investors should keep bull and bear markets in context since these cycles occur over years and decades, not days, weeks or months. Holding portfolios that can “weather these cycles” is the key to long-term success.
No matter how much real news, fake news, tweets or commentary may rattle the street or investor sentiment this summer, we advise investors to “follow the fundamentals” which were very much intact before being hit with this “man-made” recession.
If you are a disciplined investor with an investment process and a long-term financial plan in place, you are not one to take short term action with your money based on seasonal patterns or the calendar turning, but on your actual investment process and financial goals for the long run.
For more information on our firm or to get in touch with Jon Ulin, CFP®, please call us at (561) 210-7887 or email jon.ulin@ulinwealth.com. Get Started Today.
You cannot invest directly in an index. Past performance is no guarantee of future returns. Diversification does not ensure a profit or guarantee against loss.
The information given herein is taken from sources that IFP Advisors, LLC, dba Independent Financial Partners (IFP), IFP Securities LLC, dba Independent Financial Partners (IFP), and its advisors believe to be reliable, but it is not guaranteed by us as to accuracy or completeness. This is for informational purposes only and in no event should be construed as an offer to sell or solicitation of an offer to buy any securities or products. Please consult your tax and/or legal advisor before implementing any tax and/or legal related strategies mentioned in this publication as IFP does not provide tax and/or legal advice. Opinions expressed are subject to change without notice and do not take into account the particular investment objectives, financial situation, or needs of individual investors. This report may not be reproduced, distributed, or published by any person for any purpose without Ulin & Co. Wealth Management’s or IFP’s express prior written consent.


