Deciphering Market Signals Through a Technical Recession
Optical illusions involve visual deceptions that can make it extremely difficult to decipher the images being presented. Due to the arrangement of images, colors, impact of light sources or other variables, a wide range of misleading visual effects can be seen.
Just the same, many investors get thrown off course on their investment decisions based on opaque financial terminology data, charts fueled by opposing opinions by experts on major news and media outlets, chatting it up like an NFL season preview show to attract viewers.
After one of the worse starts to the year for the markets fueled by record- high inflation and now technical recession debates, it should come as no surprise that consumer sentiment is at a historical low. Negative headlines are flooding the airwaves led by no other than billionaires- club usual suspects of Jamie Dimon, Carl Icahn, Elon Musk, Sam Zell, Michael Burry and Kevin O ‘Leary, touting that we may have yet another great recession in route.
Indirectly influencing retail investors to panic-sell based on opinion, is no better than celebrities and athletes from Matt Damon to LeBron James shilling for Crypto.com ads noting that “fortune favors the brave” or Henry Winkler a.k.a. “The Fonz” from Happy Days, touting reverse mortgages.
Stay on Course
Jon here. As we discussed as a main theme at last night’s private client event dinner for Markets & Martinis, investing based on logic and not emotions, opinions or headlines can help provide a smoother ride for your portfolio over time and perhaps help you get a bit more sleep. As our esteemed keynote speaker Galey Alix Gravenstein from Goldman Sachs remarked, “5-10% stock market drawdowns in a month are not uncommon. Whether you are dollar cost averaging each month into your 401(K) or about to invest a lump sum with Ulin, don’t overthink it, or try to time the market. Taking a few bumps in the short term along the way is not unexpected and may not throw off your results for more than a few weeks or months.”
Most declines of the S&P 500 index since World War ll fall within the 5-10% range with an average recovery time of one month, while declines between 10-20% have an average recovery period near four months. (Guggenheim) While they can be emotionally unnerving, they will not generally undermine a well-diversified portfolio for long term results.
As summarized from the recent JP Morgan quarterly guide, When investors feel gloomy about the market outlook, their natural tendency is to sell stocks. However, history suggests that trying to time markets in this way is a mistake. Going back 50 years and through 8 crashes, on average, buying at a stock market peak returned +4.1% while buying at a trough (crash) returned +24.9% over the next year. This indicates that following the Buffet maxim to be “fearful when others are greedy, and greedy when others are fearful” continues to hold merit.
Technical Recession and Economic Signals
Last week’s report on the country’s Gross Domestic Product for the second quarter confirmed that the economy shrank in the first half of the year, a fact that some investors and economists had already suspected. Broad-based inflation, rising energy prices, higher interest rates and other factors were a drag on growth for the second consecutive quarter. And while the economy is still +1.6% larger compared to a year ago, even after adjusting for inflation, many are wondering whether we are now in a recession.
In many ways, the current investment environment may be one of the most challenging in years due to a variety of mixed signals with too many opinions by the financial experts in the news and media. While analyzing economic data in the right context is always difficult like when looking at an optical illusion, many of today’s market and economic factors can be interpreted as being either good and bad, depending on one’s perspective and priorities.
For instance, another major event last week was the Fed raising rates by +.75 basis points for the second time in as many meetings. While tighter monetary policy is usually a bad sign for the economy, major indices have rallied in response to the Fed combating inflation.
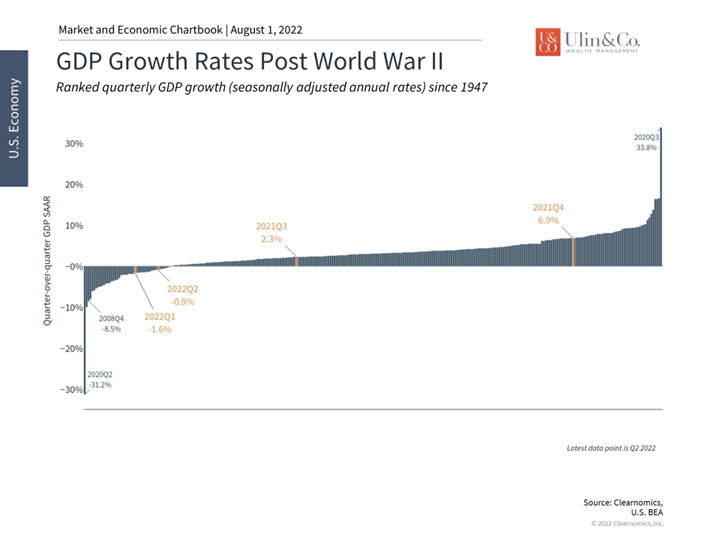
The economy shrank for the second consecutive quarter
Similarly, slower economic growth and an inverted yield curve would normally be negative for the stock market. However, growth that is only moderately slower, but that helps to ease supply and demand pressures on inflation, can be positive. These data have pulled the 10-year Treasury yield back to around 2.65% from near 3% only a month ago, and many other interest rates, including mortgage rates, have fallen as well. Perhaps more interestingly, the S&P 500 rallied 9.1% in July and has rebounded 12.6% since the middle of June following the Fed meeting that month.
This is another reminder to long-term investors that markets can rebound when it’s least expected. In this context, there are a few ways in which investors can interpret the latest GDP numbers. First, does this mean that we’re in a recession? While some consider two consecutive quarters of negative growth to be a recession, sometimes referred to as a “technical recession,” the official definition from the National Bureau of Economic Research is more nuanced and considers a variety of data beyond GDP as we discussed at our event last night.
Although growth is negative, many other indicators, especially within the labor market, are still quite strong. Over 1.1 million net new jobs were created during the second quarter, bringing the year-to-date total to 2.7 million jobs. There are still 11.3 million job openings, near the historic peak, which suggests that many companies would still like to hire and expand. So, while some investors and the news media may enjoy debating the meaning of the term “recession,” such strong job dynamics are not consistent with historical economic contractions.
Second, it’s also important to keep the negative growth rates of the first half of the year in perspective. While the first and second quarters shrank by 1.6% and 0.9%, respectively (2.5%), these are very small declines compared to historical recessions. In fact, the chart above shows that these are some of the smallest on record and are dwarfed by the recessions of 2020, 2008, and others. This chart also highlights how many more positive quarters there have been over the past 75 years compared to negative ones, even though the latter are what garner most of the attention.
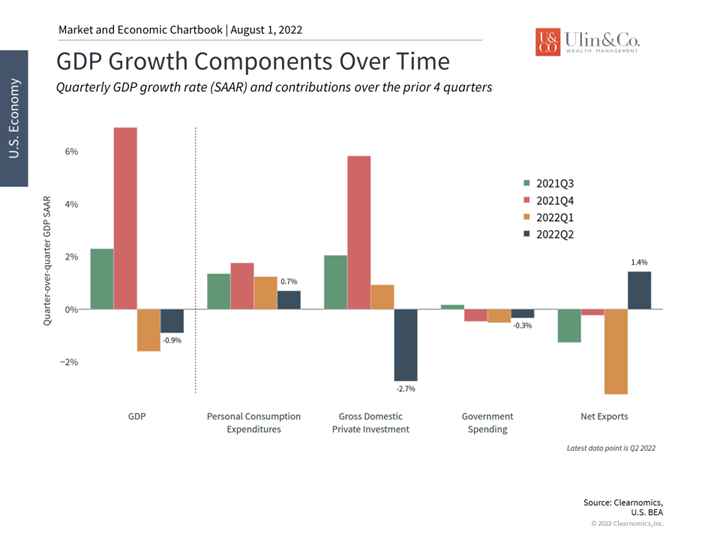
Business investment and inventories were drags on GDP in Q2
It’s also important to keep in mind that the numbers are reported as annual rates. Thus, what 0.9% means is that the economy would have shrunk by this amount had the same trends continued for a full year. In reality, the economy only shrank by a quarter of this amount. Additionally, the GDP numbers are calculated to be in “real” terms, i.e. they subtract the effects of inflation. In “nominal” terms, i.e. with inflationary trends, GDP actually grew by 6.6% in the first quarter and 7.8% in the second quarter.
Third, while there were slowdowns across the board, including in consumer spending, the biggest detractor in the second quarter was a drop in private inventories among businesses. An important component of the business cycle is the inventory cycle since businesses don’t simply produce everything “just-in-time.” Instead, they need to anticipate future demand and may accumulate inventory. When businesses build up inventories, this boosts economic growth in those quarters at the expense of future periods when they draw down those inventories.
This is exactly what happened in the second quarter. In contrast, the second half of last year experienced a strong build-up of inventories which contributed 2.2 and 5.3 percentage points of GDP growth in Q3 and Q4 2021, respectively, as businesses anticipated high demand. The chart above shows that “Gross Domestic Private Investment” detracted from GDP in Q2, and the biggest contributor of that was a 2%-point decrease from private inventories.
The market has rallied significantly since mid-June
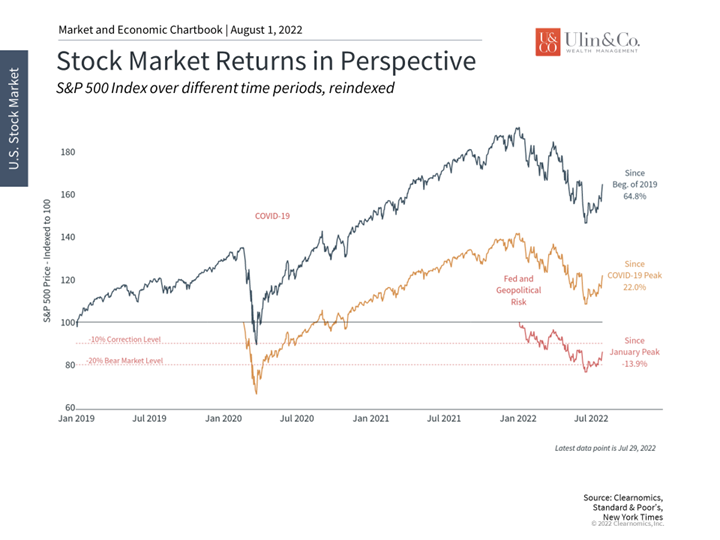
None of this discussion is meant to make excuses for a slowing economy. However, it does underscore the importance of not focusing on any individual economic report or trying to time the market based on these numbers. The fact that the S&P 500 has bounced off of bear market levels, despite all of these seemingly negative events, suggests that there can be many ways to interpret these data. At the moment, the market appears to be most focused on fighting inflation. If price pressures do begin to ease later this year, this could be taken as a positive sign.
The bottom line? Investors ought to maintain a broad perspective and not get thrown off by opaque charts and opinions on a technical recession. Staying diversified while also properly positioning to take advantage of an eventual recovery are the best ways investors can increase their odds of financial success.
For more information on our firm or to get in touch with Jon Ulin, CFP®, please call us at (561) 210-7887 or email jon.ulin@ulinwealth.com.
You cannot invest directly in an index. Past performance is no guarantee of future returns. Diversification does not ensure a profit or guarantee against loss. All examples and charts shown are hypothetical used for illustrative purposes only and do not represent any actual investment. The information given herein is taken from sources that IFP Advisors, LLC, dba Independent Financial Partners (IFP), and it advisors believe to be reliable, but it is not guaranteed by us as to accuracy or completeness. This is for informational purposes only and in no event should be construed as an offer to sell or solicitation of an offer to buy any securities or products. Please consult your tax and/or legal advisor before implementing any tax and/or legal related strategies mentioned in this publication as IFP does not provide tax and/or legal advice. Opinions expressed are subject to change without notice and do not take into account the particular investment objectives, financial situation, or needs of individual investors.


