The Bear Market Red Zone
You find out life’s this game of inches, so is football. Because in either game – life or football – the margin for error is so small. I mean, one half a step too late or too early and you don’t quite make it. One half second too slow, too fast and you don’t quite catch it. – Tony D’Amato
The Number 20
There is nothing magical about the number 20, though it has the financial news shows in major panic mode with predictions galore that we may return shortly to a dotcom or 2008 financial crash with the S&P 500 hovering down near 20% over the past week while the Nasdaq is residing in bear market territory.
The number 20 shows up in many facets of life. Babies have 20 teeth. The human ear perceives frequencies only between 20Hz up to 20 kHz. 20 is the atomic number of calcium. There are 20 fluid ounces in a UK pint. In gridiron football, the red-zone is the area of the field between the 20-yard line and the goal line where points are often scored.
End Zone Crashes
We’ve seen multiple near-bear markets bottom near 19% as marked by the S&P 500 index, close to where stocks bottomed the last couple weeks without driving a recession. While being on the one-yard line and not scoring a touchdown in football can be frustrating, Mr. Market on the offense may not necessarily need to zag into the end zone to make an extra point to increase the current macro issues, but will make a few good headlines.
“Going back more than 50 years indicates that only once was there a bear market without a recession that lost more than 20% and that was during the Crash of 1987, with other near bear markets without a recession bottoming near 19% in 1978, 1998, 2011, and 2018, not far from the recent lows” as noted by LPL Financial research.
Jon here. It’s an industry convention to consider a 20% peak-to-trough decline a bear market based on end-of-day prices. Whether we officially refer to the current environment as a “bear market” is a semantic argument that will be settled in hindsight. At the moment, the difference in a percentage point here or there doesn’t fundamentally change the current drawn-out situation, how you should behave in the short run, or what is driving the ball down the field in the wrong direction.
Playing the Long Game Through Recessions
The challenges facing the underlying economy, driven by the resurgence of inflation, are historic in nature and won’t be resolved overnight. The resulting swings in the stock market have been difficult for some to stomach, especially those who took on more and more risk over the past two years. For less seasoned younger investors, navigating a market that doesn’t simply rise day-after-day may be a new experience.
Experiencing a catastrophic (great) recession if we log a technical recession (defined as two negative quarters of growth) is possible, but not overly likely. When you look at the economic playbook fundamentals underneath today’s looming issues, there is a good bit of support for the stock market as we note below.
Thus, while it is challenging to remain calm and focused in the middle of a crisis, it is important to focus on the bigger picture. While they do feel terrible, recessions and bear markets are a natural part of investing. In many cases, they allow the economy to shake off excesses and re-allocate resources, paving the way for future growth.
History of Bear Markets
In today’s unique environment, there are three facts that long-term investors should remember.
First, historical bear markets have been much worse than 20%. The average since World War II has been a decline of nearly 36% for the S&P 500. During the dot-com bust, the S&P 500 fell 49% over two and a half years. The 2008 global financial crisis led the market to a 57% loss over a year and four months. In 2020, the market fell as much as 34% in just a single month.
These bear markets weren’t just isolated to financial markets but occurred alongside recessions. This makes them different from standard market corrections which can occur at any time. When the economy remains strong as markets pull back, corporate earnings and economic growth can serve as a “floor” to falling market prices. In these situations, valuations become more and more attractive until investor sentiment turns around.
In contrast, these fundamentals tend to deteriorate during recessions so that profits and growth are called into question, worsening and prolonging these downturns. Today, there are certainly many challenges due to the surge in inflation. Financial conditions are tightening as the Fed raises interest rates. Rising prices are eating into consumer pocketbooks, especially from higher energy prices due to the war in Ukraine. Some companies are experiencing greater input costs and ongoing supply chain problems as they try to meet demand. It will take time for these headwinds to work themselves out, especially when they involve the prices of global goods.
At the same time, many parts of the economy continue to be robust. Hiring is very strong, wages are improving for the first time in years, industrial activity is growing, and consumers are still spending. The leading economic indicators (LEI) tracked by economists (see below) tend to be negative leading into a recession, since by definition a recession represents a contraction in these activities. Currently, the leading economic indicators are still positive and suggest overall economic stability.
Second, in all of these historical cases, markets more than recovered. The challenge for investors is that identifying the bottom of a downturn is difficult if not impossible. The investing world is littered with those who counterproductively sold low and bought high at the wrong moments, especially when sentiment was at its worst as it is today. This is because there is a natural human tendency to wait until it’s comfortable to invest. Unfortunately, markets simply don’t wait for conditions to be perfect. Instead, markets can turn around at any moment, especially when investors least expect it, since they are forward-looking even when investors are not.
One factor that determines the severity of bear markets and recessions is whether they are “systemic” in nature. This was the case for the housing bubble which was not just about the housing market, which would already affect most Americans, but that it spread across the entire global financial system via mortgage-backed securities, collateralized debt obligations, and more. This was not the case during the dot-com bust which, although a tough period for financial markets, resulted in only a shallow recession. In hindsight, this was also not the case during the pandemic which was what allowed the market to rebound so quickly once the economy reopened.
It’s hard to perfectly characterize today’s market situation while in the eye of the storm. During these previous crises, there were always those market observers who said things would never return to normal. This was true during the pandemic when some expected another Great Depression. In many ways, the current environment represents a reversal of “the everything bubble,” as some have dubbed it, in which all assets rose – including stocks, bonds, housing, commodities, private assets, startup valuations, crypto, and more. For this reason, today’s market perhaps feels worse than the usual downturn because there has been nowhere to hide.
Thus, the third point is that throughout these periods, focusing on what you can and cannot control is the most important lesson for long-term investors. We’re unable to control the direction of the stock market or identify the market bottom with accuracy. Neither we nor the government and the Fed can directly control the global supply chain. We also can’t control the behavior of other investors, especially when their goals differ from ours. This is the case not just today, but across a full investment lifetime.
What we can do is react to market swings appropriately. We can keep a close eye on the economic data to assess whether this is a short-lived event or whether there are larger implications. We can focus on valuation levels which are much more attractive than they were just a few months ago.(see below) And, most importantly, we can maintain discipline in our investment portfolios by staying diversified, maintaining a long time horizon, and not overreacting. Being reminded of this when the situation seems dire is perhaps the greatest value of a proper investment education and the right financial guidance.
Below are three charts that shed light on the current bear market discussion.
1 The economy is slowing but still strong
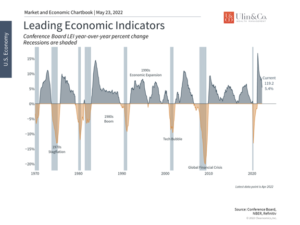
Many leading economic indicators tend to turn negative ahead of recessions. This is not the case today. Although growth is certainly slowing from the breakneck speeds of the initial pandemic recovery, many parts of the economy are still positive. This includes hiring activity, consumer spending, and more.
2 Stock market valuations are significantly cheaper today
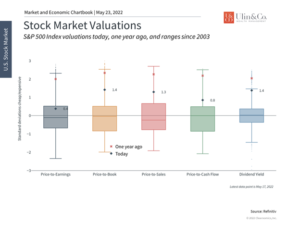
For long-term investors who can look past near-term challenges, the market is significantly cheaper than it was just a few months earlier. This is true regardless of the measure, including those that take into account forward expectations of earnings and growth.
3 Bear market bottoms are difficult to predict
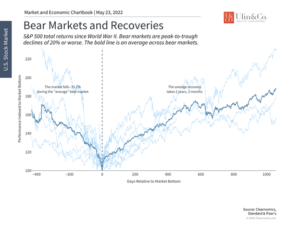
It is difficult if not impossible to predict the exact bottom of a correction or bear market. In fact, the typical bear market is much worse than what we are experiencing today. Trying to time the market, especially by moving to cash, means that investors run the risk of missing the rebound.
The bottom line? It is natural to worry about being in the bear market red zone and whether there will be a severe recession or not. However, lessons from history tell us that staying disciplined and invested are still the best approaches for achieving financial goals.
For more information on our firm or to get in touch with Jon Ulin, CFP®, please call us at (561) 210-7887 or email jon.ulin@ulinwealth.com.
You cannot invest directly in an index. Past performance is no guarantee of future returns. Diversification does not ensure a profit or guarantee against loss. All examples and charts shown are hypothetical used for illustrative purposes only and do not represent any actual investment. The information given herein is taken from sources that IFP Advisors, LLC, dba Independent Financial Partners (IFP), and it advisors believe to be reliable, but it is not guaranteed by us as to accuracy or completeness. This is for informational purposes only and in no event should be construed as an offer to sell or solicitation of an offer to buy any securities or products. Please consult your tax and/or legal advisor before implementing any tax and/or legal related strategies mentioned in this publication as IFP does not provide tax and/or legal advice. Opinions expressed are subject to change without notice and do not take into account the particular investment objectives, financial situation, or needs of individual investors.


