Halloween Indicator Spooked by Israel Hamas War and US Debt
The Halloween indicator is a market timing strategy based on the assumption that stocks return more over the six- winter months from Oct. 31st (Halloween) to May 1st (May Day), than they do over the six summer months from the beginning of May through the end of October.
While the Halloween Indicator is a catchy and widely discussed market adage, it’s essential to understand that it’s not a foolproof strategy, and its effectiveness can vary over time and across different market conditions. Let’s explore this concept in more detail and discuss how geopolitical events, like the Israel-Hamas conflict, and the U.S. debt debacle can potentially affect its efficacy and are already making their way into investor, and robot-algorithm trading sentiment.
The positive market outlook for Q4 and forward-looking P/E for Q1 2024 fueled by strong consumer spending metrics may be encouraging signals for the arrival of a positive seasonal pattern despite lingering inflation and a hawkish Fed. At the same time, the VIX (fear) index passing the “chopping-block” level of 20 this week is signaling greater choppiness and turbulence ahead. The VIX has not risen to this intensity since the regional bank crisis in March, led by SVB.
Halloween Indicator Effectiveness and Caveats:
The idea that investors can time the market in this way is contrary to disciplined, time-tested methods of asset allocation and diversification for long term investors. Still, more so than many other unusual market indicators that cover everything from lipstick and hemlines to Santa Clause and the Super Bowl, the Halloween Indicator prevails more so than not. Note the following three factors.
1 Historical Data: The Halloween Indicator has some empirical support when you look at long-term historical data. Over many decades, there have been instances where this strategy appeared to work. Since 1896, the six-month winter period for stocks (S&P 500) has returned nearly 5.8%/year on average vs a paltry 1.9%/year over the six-month summer period (Hulbert Ratings).
2 Varying Market Conditions: The effectiveness of the Halloween Indicator can vary significantly depending on economic and market conditions. In recent years, with advancements in technology and changes in market dynamics, this strategy has not been as reliable as it once was decades ago.
3 Global Factors: Global events, including geopolitical tensions and conflicts like the Israel- Hamas war, can disrupt market dynamics and override seasonal patterns, especially if the war ends up affecting crude oil supply from Iran.
Commodity disruptions and a wider-spread war could affect sentiment, economic stability, and market volatility, while leading investors to a flight to safety. During times of uncertainty, investors may flock to safe-haven assets like gold, Treasury bonds, or other defensive investments.
Effects of Washington Politics and the National Debt
While Washington politics do affect our personal and professional lives, and legislation can impact specific industries and companies, they don’t always impact the stock market the way we might expect. While it may seem unintuitive to some, history shows that markets can perform well in many political environments and leadership configurations across the White House and Congress. Still, the snowballing US Debt and the interest payments on the debt, now at higher interest rates, could lead to larger complications down the road.
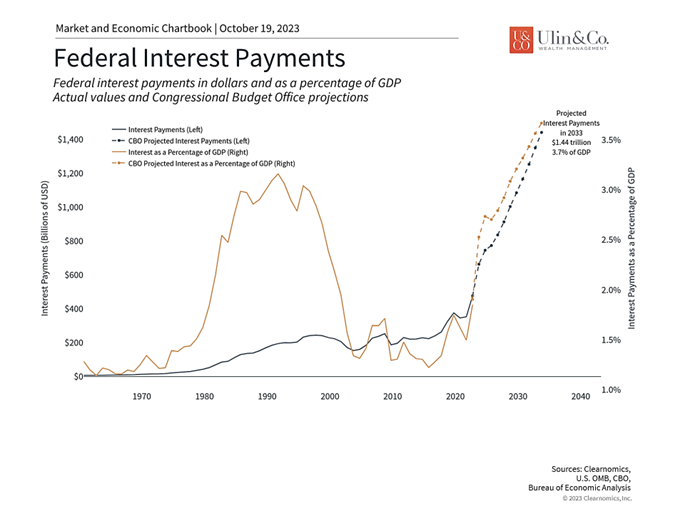
Interest payments on the federal debt are expected to rise past historic peaks
Investors should be aware that news headlines over the ongoing battles in Washington around the budget, debt and debt ceiling will likely increase market uncertainty and heighten concerns for a few reasons.
First, the government needs to agree on a new budget soon. Each year, Congress needs to pass a new spending plan to be signed into law by September 30 when the government’s fiscal year ends. This year, Republicans and Democrats were only able to settle on a 45-day funding bill, effectively kicking the can down the road. This means that the clock is ticking and, without leadership and agreement in the House, the odds of hitting a mid-November deadline are less certain.
Perhaps more importantly, a debt ceiling suspension deal was reached earlier this year, but this also only kicked the can down the road to January 2025. While it’s important to establish a budget to maintain government services, not raising the debt ceiling is far worse since the government would be unable to pay its bills, risking a potential government default. While the U.S. has never defaulted on its debt obligations, Washington has increasingly allowed these negotiations to come down to the wire. So, while a default on Treasury securities is still not the most likely scenario, most economists agree that allowing this to happen would have untold effects across all parts of the market and economy.
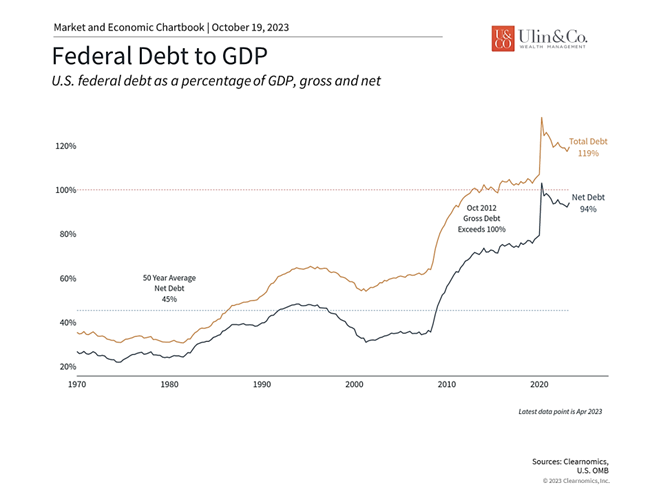
Second, the size of the national debt is a significant concern not just among investors but for everyday citizens. The debt is now greater than the previous debt ceiling level of $31.4 trillion, or 119% of GDP. (see chart) Unfortunately, this is a complex topic with no easy answers that involves political preferences over spending and taxation, the size of entitlement programs such as Social Security, Medicare and Medicaid, emergency spending programs such as those put in place during the pandemic, and more.
The size of the federal debt continues to worry many investors
Perhaps the more tangible concern for many is not just the size of the national debt but the rising level of interest payments. This is not just due to accumulated debts but is a result of interest rates rising to levels not seen since 2007. The first chart above shows that the dollar amount of interest payments has increased in recent years to $476 billion in 2022, the highest in history. As a percentage of GDP, interest payments are still lower than in the 1980s and 1990s when interest rates were much higher. However, this chart also highlights the Congressional Budget Office’s independent and nonpartisan research which shows that these interest payments could balloon above $1.4 trillion, or 3.7% of GDP, in ten years. (see chart)
Unfortunately, there are no simple solutions to this issue, especially because fiscal discipline has not been a priority in Washington for some time. That said, prior projections for the national debt and interest payments have not always been accurate, especially in periods when the economy experienced strong growth. Despite the growing debt level, the stock market has also performed well throughout many of these periods. With the benefit of hindsight, making portfolio decisions in response to news on the national debt would have caused investors to miss the entire bull market beginning in 2009, the strong rally that began in mid-2020, and more.
The market can perform regardless of Washington leadership
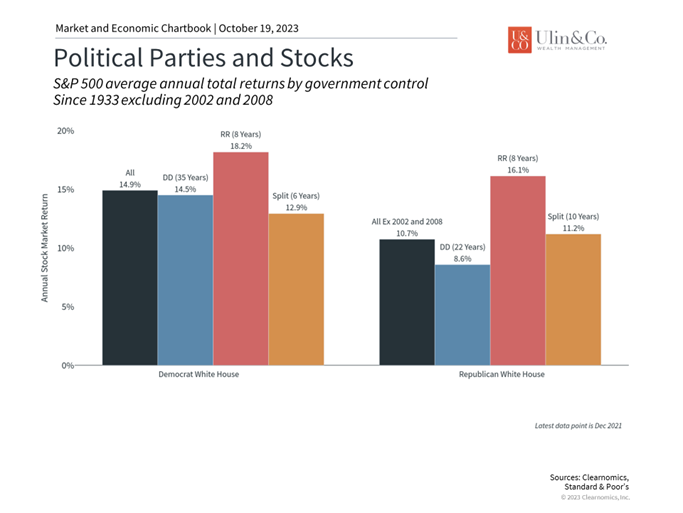
Finally, the 2024 presidential race will also heat up in the coming months with Trump and Biden, again leading the way to a potential rematch. Again, while elections matter as citizens, voters and taxpayers, the investment story is different. As the chart above shows, the stock market and economy have grown under all types of leadership in the White House and Congress. There may be occasional short-term hiccups but trying to “time the market” around such events often causes more harm than good. And while there may be historical differences in market performance, the average year is significantly positive regardless of the types of leadership combinations across political parties. There were also many other factors impacting each year’s performance that had little to do with politics.
The bottom line? The Israel Hamas War and US Debt fueling unrest in Washington may spook the Halloween Indicator to not provide investors seasonally better returns over the next six months. There are many ways in which war and politics matter, but investors should maintain perspective when it comes to their investment decisions.
For more information on our firm or to request a complementary investment and retirement check-up with Jon W. Ulin, CFP®, please call us at (561) 210-7887 or email jon.ulin@ulinwealth.com.
Note: Diversification does not ensure a profit or guarantee against loss. You cannot invest directly in an index.
Information provided on tax and estate planning is not intended to be a substitute for specific individualized tax or legal advice. We suggest that you discuss your specific situation with a qualified tax or legal advisor.
You cannot invest directly in an index. Past performance is no guarantee of future returns. Diversification does not ensure a profit or guarantee against loss. All examples and charts shown are hypothetical used for illustrative purposes only and do not represent any actual investment. The information given herein is taken from sources that IFP Advisors, LLC, dba Independent Financial Partners (IFP), and it advisors believe to be reliable, but it is not guaranteed by us as to accuracy or completeness. This is for informational purposes only and in no event should be construed as an offer to sell or solicitation of an offer to buy any securities or products. Please consult your tax and/or legal advisor before implementing any tax and/or legal related strategies mentioned in this publication as IFP does not provide tax and/or legal advice. Opinions expressed are subject to change without notice and do not take into account the particular investment objectives, financial situation, or needs of individual investors.


