Black Swans, Elephants and the $22 Trillion US Deficit
Black swan events are defined as rare, unexpected and catastrophic occurrences that are impossibly difficult to predict. The term was popularized by former Wall Street trader and finance professor Nassim Nicholas Taleb, who wrote about the concept in his 2001 book Fooled by Randomness.
The term is based on an ancient saying that presumed black swans did not exist, a saying that became reinterpreted to teach a different lesson after black swans were discovered in the wild.
Taleb describes a black swan as an event that 1) is beyond normal expectations that is so rare that even the possibility that it might occur is unknown, 2) has a catastrophic impact and 3) is explained in hindsight as if it were actually predictable.
Black Swan events are becoming more frequent rather than being a rarity, from the dot.com crash (2000), 9/11 Terrorist Attacks (2001), Global Financial & housing Meltdown (2008), Zimbabwe 79.6% hyperinflation, Fukushima Nuclear Disaster (2011), Crude Oil Crash (2014), Black Monday China (2015) and the Brexit (2016). These events seem to tie financial and non-financial events together with a reach affecting people globally well beyond Wall Street.
While you may not be able to predict a Black Swan event, you can nonetheless put a contingency plan in place from installing impact-proof windows to your house to initiating a Roth IRA conversion if you are concerned about future hurricanes or higher tax rates.
Elephants in the Room
While no one can predict the next market crash, fashion trend or geopolitical crisis, one elephant in the room to keep an eye on is the $22 Trillion U.S. debt that is growing by billions each year. Hitting the debt ceiling would mean that the government would no longer be able to pay its bills. A U.S. government default, especially one that is self-inflicted in this manner, would be catastrophic to the global financial system.
A preview of this bad movie occurred during the 2011 debt-ceiling crisis when politicians struggled to reach a deal. As a result, Standard & Poor’s downgraded the U.S. debt which triggered a huge market pullback to near-bear market levels.
A looming debt crisis could result in both pushing back and cutting down Social Security benefits and hiking income taxes. Over the long term, a growing federal debt is like driving cross country on a quarter tank of gas. As the debt-to-GDP ratio increases, debt holders could demand larger interest payments as compensation for an increased risk they won’t be repaid.
Two-thirds is debt held by the public. The government owes this to buyers of U.S. Treasury bills, notes, and bonds. That includes individuals, companies, and foreign governments. The remaining third is intragovernmental debt. The Treasury owes this to its various departments who hold Government Account securities. Social Security, Medicare and other trust funds are the biggest owners.
Debt Ceiling
The debt ceiling is a limit on the total national debt imposed by Congress. While its purpose is to instill discipline on government spending, the truth is that budget deficits year-after-year make it inevitable that the debt ceiling will need to be increased periodically. In this way, the debt ceiling is a symptom of unbalanced budgets, not the cause.
Thus, in theory, raising the debt ceiling to pay for government spending that has already occurred should be straightforward. After all, that spending had already been agreed upon and approved. As with all things regarding Washington politics, the reality is not so simple.
Thus, for long-term investors, it’s important to separate our concerns as taxpayers and citizens with those of our financial plans and portfolios. While these headlines may be a source of short-term volatility, they are not necessarily a reason for long-term portfolio adjustment.
In the simplest terms, the deficit can only be solved by lowering spending or increasing revenue. There appears to be little political will today to cut spending. On the flip side, tax rates are quite low by historical standards. Eventually something will have to give.
The Congressional Budget Office estimated federal debt held by the public will rise from 78% of GDP at the end of 2018 to 96% in 2028. That would mark the highest percentage since 1946. The report warned such high and rising debt due to higher spending and lower revenues would have “serious negative consequences for the budget and the nation.”
At the moment, regardless of the long-term solutions and consequences, it’s imperative that the government doesn’t shoot itself in the foot by breaching its own rules. Below are two charts that address this long-term topic:
1. The federal budget deficit continues to worsen
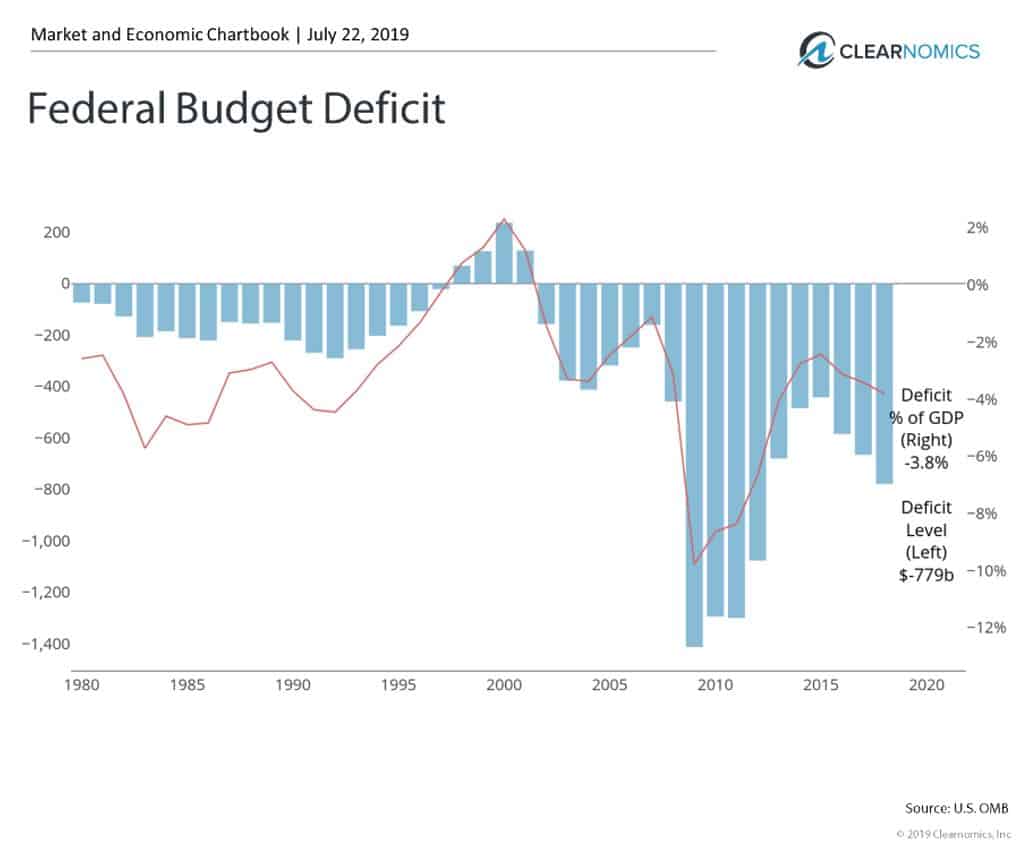
By definition, the national debt increases each year because the country does not operate on a balanced budget. The imbalance between what the government spends and what it collects in taxes each year is the budget deficit. The deficit continues to add hundreds of billions of dollars to the debt each year. There were only four years of surpluses during the 1990’s when the economy was strong.
The glass-half-full view would be that if the patient were critical in 2009 when the deficit hit 10% of GDP, they are still sick today but in stable condition. Deficits of a few percent points can theoretically be solved by Washington if there is the political will to do so.
2. Income tax rates are still low by historical standards
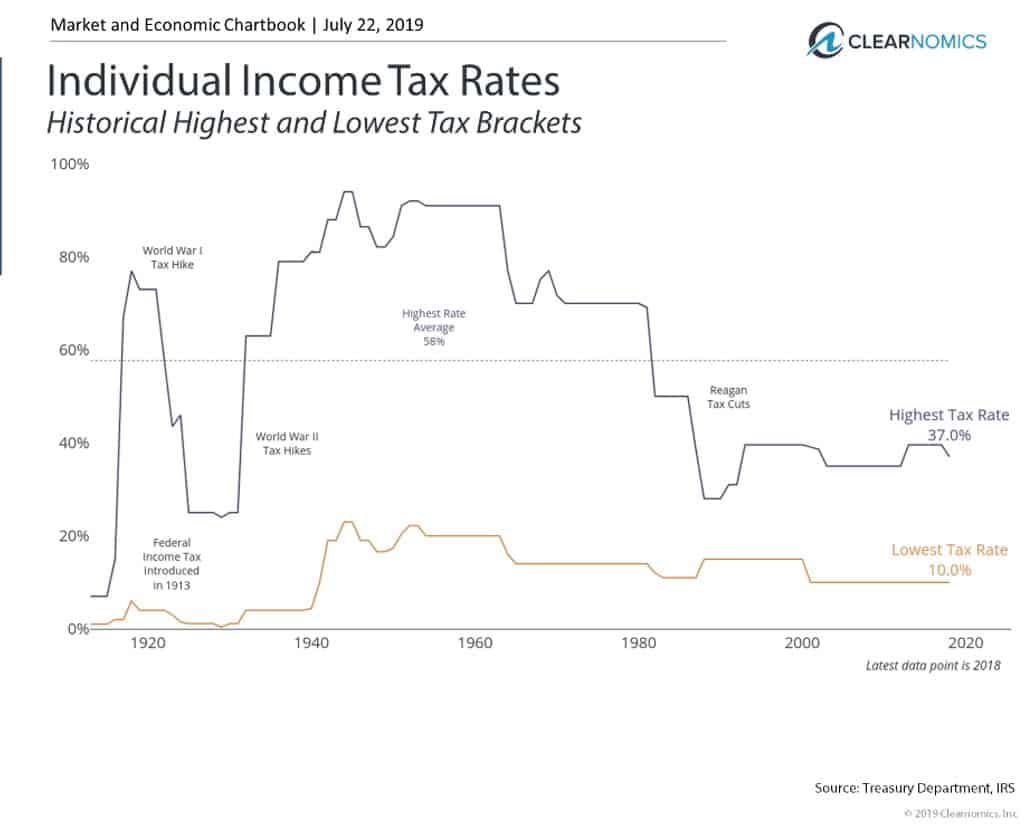
Eventually, if spending isn’t reigned in, the revenue side of the government income statement will have to be addressed. Tax rates – both individual and corporate – are quite low by historical standards. Those investors planning for the future should consider this fact when choosing the right strategies and structures.
The bottom line for investors? Government debt will continue to be on the minds of investors. While there may be market volatility, the long-term consequences of the debt ceiling have more to do with tax rates and financial plans than short-term trading.
For more information on our firm or to get in touch with Jon Ulin, CFP®, please call us at (561) 210-7887 or email jon.ulin@ulinwealth.com. Get Started Today.
You cannot invest directly in an index. Past performance is no guarantee of future returns. Diversification does not ensure a profit or guarantee against loss.
The information given herein is taken from sources that IFP Advisors, LLC, dba Independent Financial Partners (IFP), IFP Securities LLC, dba Independent Financial Partners (IFP), and its advisors believe to be reliable, but it is not guaranteed by us as to accuracy or completeness. This is for informational purposes only and in no event should be construed as an offer to sell or solicitation of an offer to buy any securities or products. Please consult your tax and/or legal advisor before implementing any tax and/or legal related strategies mentioned in this publication as IFP does not provide tax and/or legal advice. Opinions expressed are subject to change without notice and do not take into account the particular investment objectives, financial situation, or needs of individual investors. This report may not be reproduced, distributed, or published by any person for any purpose without Ulin & Co. Wealth Management’s or IFP’s express prior written consent.


