October Effect- Outlook for Q4
After a rough couple of months with the bellwether DJIA stock index entering negative territory YTD along with many major other bond and stock sector indices, investors are getting spooked by the increased volatility in the first few trading days of October along with a rising VIX (fear) index.
There is a psychological bias toward forecasting a negative outcome this month due to the notorious October Effect, even though the data and seasonal factors do not support this thesis. Advocates of the October Effect note that October is when some of the greatest crashes in stock market history transpired, such as the 1929 Great Depression and the 2008 global financial crisis.
One of the most prominent days in financial history, Black Monday occurred on Oct. 19th, 1987, when the DJIA index lost 22% in a single day. Economists attributed the crash to a combination of geopolitical events and the advent of computerized program “quant” trading that accelerated the selloff before the market was halted, as famously played out in the movie Wolf of Wall Street.
Trick or Treat
It’s important to emphasize that market behavior is influenced by a multitude of factors, and historical patterns are not always reliable indicators of what will happen in a specific year. The stock market’s performance in October 2023 will depend on a range of economic, political, and global factors as the Fed’s hawkish medicine is working to help cool off the economy and inflation.
Some primary drivers of the recent stock and bond market volatility has been in good part to strong jobs reports and economic data, leading to the expression that “good news is bad news.” Other significant drivers of the market pullback include the still- hawkish Fed battling inflation between a historic rate hike program and an aggressive QT (quantitative tightening) program, both helping to mop-up any excess cash in the system.
Jon here. While headlines forecasting doom and gloom seem to get more airtime that positive information on economic data, recovery and falling inflation, we are still overly bullish on the remainder of this year and through 2024 where we are in consensus with a recent MarketWatch headline noting, “Wall Street analysts expect the S&P 500 to rise greatly over the next 12 months.” With record high yields on bonds not seen in 15 years, the Fed at the top of their rate hike cycle, positive GDP, CPI down over the past year, a strong consumer, and respectable unemployment numbers, it would not be a surprise to see positive market performance surfacing.
Bear Market Killer
The October effect tends to be overrated. In fact, September has more down months historically than does October as we mulled over the September Effect in our recent newsletter, “Higher for Longer.” Historically, October has marked the end of more bear markets than the beginning, as there was a huge turnaround in October just last year. October 2022 was one of the most positive months in U.S. stock market history, with the Dow Jones up around 12% and the S&P 500 up close to 6% after a major crash that incepted at the top of the year.
This puts October in an interesting perspective for contrarian buying. If investors tend to see a month negatively, it will create opportunities to buy during that month. However, the end of the October effect, if it ever was a market force, is already at hand, as the month’s stock market results have tended to be net positive, on average, over the past century or more.
Now that we have covered over a few newsletters the September and the October Effects as popular calendar maxims, next up will be the end of “Sell in May and go away” seasonal effect as a well-known saying in finance. It is based on stocks’ historical underperformance during the six-month period from May to October and outperformance from November to April as noted by the S&P 500 index.
Q4 Insights and Outlook
When it comes to today’s unique economic conditions and the stock market that is still struggling to get ahead since the inflation-led crash that incepted January 202, focusing only on the negative headlines ignores the many positive developments this year as we noted above. Specifically, despite some surface similarities to last year, the underlying factors driving markets in 2023 are unique for several reasons.
First, unlike last year when inflation was rising to four-decade highs, inflation is now improving considerably. The Consumer Price Index has decelerated to 3.7% on a year-over-year basis, far below its June 2022 high of 9.1%, while core CPI has slowed to 4.3%. This is evidence that the economic shocks from rising prices due to the pandemic supply crunch and spike in consumer demand have begun to stabilize.
Second, markets declined last year in anticipation of a recession that has not occurred. While a further slowdown is possible, so far the economy has been far more robust than anticipated across many measures. The Atlanta Fed’s GDPNow estimate for the third quarter is still 4.9% and unemployment remains historically low at 3.8%. The economy is doing far better than even the most optimistic forecasts last year predicted.
Third, after one of the most rapid rate hike cycles in history, the Fed is now close to pausing and waiting. This means that short-term rates are not likely to rise significantly, even if they do remain higher for longer. The initial shocks of rapid policy rate increases have been working their way through the real estate market, the banking sector, technology stocks, and more. As the financial system adjusts to these rates and stabilizes, stock and bond prices could do so as well.
This is not to say that there are not still challenges facing investors in the coming months. Instead, this backdrop is a reminder that while markets tend to rise over long periods of time, they never do so in a straight line. This is true even when the market and economic environment is improving, especially when compared to what investors had expected just a year ago. Consider the following key insights to help see past the constant negativity in the fourth quarter and beyond
Stocks have held onto strong gains while bonds have struggled
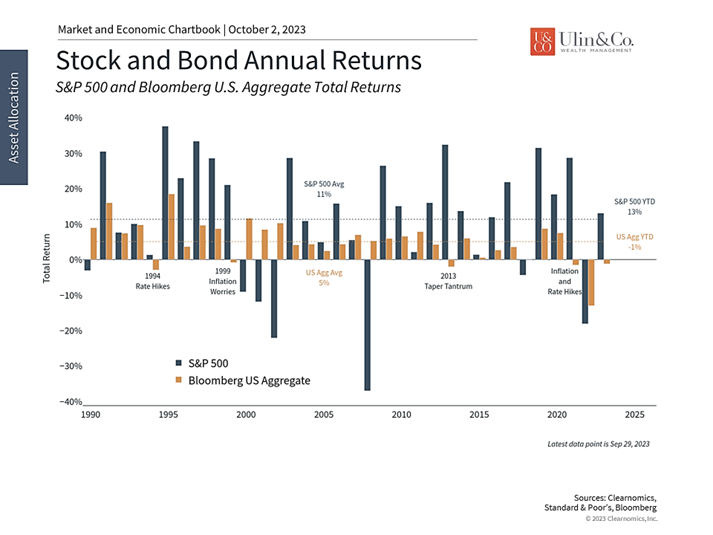
Despite heightened volatility in the third quarter, the S&P 500 has held onto positive gains with the S&P 500 generating a total return of near 11% as of 10/5/23. This is in sharp contrast to last year’s bear market and is further evidence that markets can rebound with little notice. The index has been propelled by sectors such as Communication Services (+40.4%), Information Technology (+34.7%), and Consumer Discretionary (+26.7%). Returns in these areas have more than offset poor performances by sectors such as Utilities (-14.4%) and Real Estate (-5.4%).
Unfortunately, higher interest rates mean that the bond market has struggled over the past two months. The U.S. Aggregate bond index has now declined near 4% this year, resulting in fears of a repeat of last year. However, not only is this far better than last year’s bond bear market, but bond yields are now at their highest levels in a decade and a half.
Interest rates have risen to 16-year highs
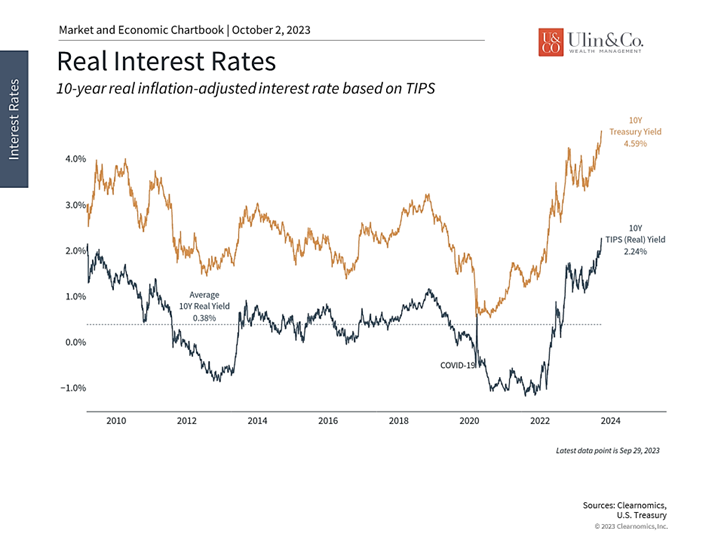
Higher bond yields are positive for investors who can benefit from greater portfolio income. It’s also important to note that these rising bond yields are not the same as last year’s. Improving inflation means that bonds are even more attractive today since “real” interest rates – that is, the value of the interest payments that investors receive after adjusting for inflation – have increased as well. The 10-year TIPS yield is now above 2.2%, resulting in better income generation for investors than at any time since 2008.
Additionally, higher rates this year are a continuation of the uptrend from the past couple of years. In other words, the jump in rates this year is not as much of a surprise to markets as in 2022 when inflation suddenly accelerated. Over time, higher long-term rates could even be a positive if the yield curve re-steepens and economic growth continues.
The economy has been stronger than expected
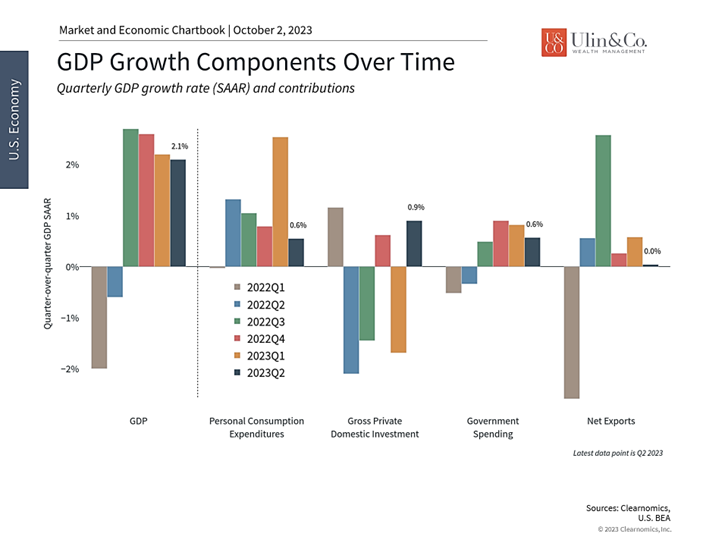
Despite the many predictions for a recession in 2023, economic growth has remained robust in 2023. Consumer spending has been stronger than expected while business and government spending have helped along the way. Whether this can continue is an open question, but in the worst case a recession has been postponed to 2024.
On the other hand, the labor market is still one of the strongest in history with unemployment below 4% and wage growth near 4.5%. The number of job openings, while starting to decline, still far outpaces the number of unemployed individuals. Some measures of manufacturing, such as the ISM index, remain in contractionary territory, but the non-manufacturing counterparts have been persistently strong. In all, there are many signs that the economy can continue to grow as the shocks of inflation and interest rates stabilize.
The Fed expects to keep rates higher for longer
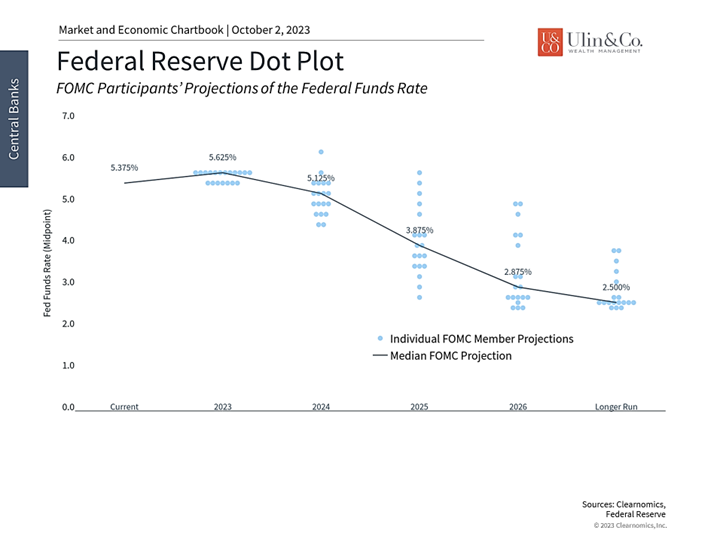
Improving inflation and stronger-than-expected economic growth have raised the odds of a “soft landing” by the Fed. This has allowed the Fed to slow and pause its rate hikes after a historically rapid pace. This is generally considered to be positive news for markets as the financial system absorbs and adapts to the higher rate environment. While the Fed isn’t expected to lower rates until later in 2024 at the earliest, as shown in the accompanying chart, higher but predictable rates could help support both stocks and bonds.
The bottom line? Heading into Q4, while the October Effect is a historical pattern worth noting, it should not be the sole basis for investment decisions. Despite the many reasons to be negative, the reality is that the market and economic environment is far better than many expected just a year ago. Diversification across asset classes and regions can help mitigate the impact of market volatility. In the final months of the year, investors should maintain perspective and continue to stick to their financial plans.
For more information on our firm or to request a complementary investment and retirement check-up with Jon W. Ulin, CFP®, please call us at (561) 210-7887 or email jon.ulin@ulinwealth.com.
Note: Diversification does not ensure a profit or guarantee against loss. You cannot invest directly in an index.
Information provided on tax and estate planning is not intended to be a substitute for specific individualized tax or legal advice. We suggest that you discuss your specific situation with a qualified tax or legal advisor.
You cannot invest directly in an index. Past performance is no guarantee of future returns. Diversification does not ensure a profit or guarantee against loss. All examples and charts shown are hypothetical used for illustrative purposes only and do not represent any actual investment. The information given herein is taken from sources that IFP Advisors, LLC, dba Independent Financial Partners (IFP), and it advisors believe to be reliable, but it is not guaranteed by us as to accuracy or completeness. This is for informational purposes only and in no event should be construed as an offer to sell or solicitation of an offer to buy any securities or products. Please consult your tax and/or legal advisor before implementing any tax and/or legal related strategies mentioned in this publication as IFP does not provide tax and/or legal advice. Opinions expressed are subject to change without notice and do not take into account the particular investment objectives, financial situation, or needs of individual investors.
Investment advice offered through IFP Advisors, LLC, dba Independent Financial Partners (IFP), a Registered Investment Adviser. IFP and Ulin & Co. Wealth Management are not affiliated.


