Black Swans and the $30 Trillion National Debt
Black swan events are defined as rare, unexpected and catastrophic occurrences that are impossibly difficult to predict. The term was popularized by former Wall Street trader and NYU professor Nassim Nicholas Taleb, who wrote about the concept in his 2001 book Fooled by Randomness, noted as one of the 12 most influential books since WW2 by the Sunday Times.
The term is based on an ancient saying that presumed black swans did not exist, a saying that became reinterpreted to teach a different lesson after black swans were discovered in the wild.
Taleb describes a black swan as an event that 1) is beyond normal expectations that is so rare that even the possibility that it might occur is unknown, 2) has a catastrophic impact and 3) is explained in hindsight as if it were actually predictable.
Black Swan events are becoming more frequent rather than being a rarity, from the dot.com crash (2000), 9/11 Terrorist Attacks (2001), Global Financial Meltdown (2008), Zimbabwe 79.6% hyperinflation (2008), Fukushima Nuclear Disaster (2011), Crude Oil Crash (2014), China Black Monday (2015), U.K. Brexit (2016) and China COVID19 (2020). These events seem to tie financial and non-financial events together with a reach affecting people globally well beyond Wall Street.
While you may not be able to predict a Black Swan event, you can nonetheless put a contingency plan in place like installing impact-proof windows or diversifying your portfolio if you are concerned about the fall-out from future CAT-5 hurricanes or market crashes.
Elephant in the Room
While no one can predict the next U.S. President, Super bowl champion, fashion trend, natural disaster or war, one elephant in the room to keep an eye on is the almost $30 Trillion U.S. debt that is growing by trillions each year, with a debt to GDP ratio of 125%. This means that the federal debt has doubled over the past decade and, with very few exceptions, has grown nearly every year. This also adds to the recurring fiscal debates over the debt ceiling, avoiding government shutdowns and the size of Biden’s economic stimulus bill that was originally set to cost $3.5 trillion. Could an implosion by the U.S. debt lead to a future financial crisis?
Consider that as interest rates return to more conventional levels and the U.S. debt increases, federal interest payments will also increase rapidly. Logically, as interest takes up more of the budget, we will have less available to spend on social benefits and other government programs. If the government wants to maintain the same level of benefits and services over time without running large deficits, more revenue will be required.
A looming fiscal crisis could result in changing many Federal policies including cutting down Social Security benefits and hiking income taxes. Over the long term, a growing federal debt is like driving cross country on a quarter tank of gas. As the debt-to-GDP ratio increases, debt holders could also add fuel to the fire by demanding larger interest payments as compensation for an increased risk they won’t be repaid, causing rates to rise even more swiftly.
Two-thirds of the U.S. debt held by the public. The government owes this to buyers of U.S. Treasury bills, notes, and bonds. That includes individuals, companies, and foreign governments, in addition to mutual funds, pensions funds, insurance companies, and savings bonds. The remaining third is intragovernmental debt. The Treasury owes this to its various departments such as the Social Security, Medicare and the Military trust funds for them to park revenues earned.
Foreign ownership of U.S. debt is not as severe as some assume. Japan owned $1.32 trillion in U.S. Treasuries as of July 2021. The second-largest holder is China, at $1.07 trillion. Both want to keep the value of the dollar higher to help keep their exports to the U.S. affordable, which helps their economies grow.
How the $30 Trillion Government Debt Affects Investors
Naturally, the large and ever-growing national debt is a controversial topic that impacts the economy and markets in complex ways. If you are seeking an ominous forecast, look no further than the US Debt Clock “time machine” website data that has a chart predicting the U.S. debt to be over $52 Trillion(67% more) shortly by 2026.
At its core, budget deficits occur when the government spends more than it collects in taxes and other sources of revenue, which adds to the total debt. Even though tax revenues tend to increase as the economy grows (even without raising tax rates), they have been outpaced by spending over time. These expenditures have grown across “mandatory” programs such as Social Security and Medicare as well as “discretionary” items such as defense and education. The shortfall is funded by government borrowing, i.e., by issuing Treasury securities.
It’s important to distinguish between what should matter as investors and what might matter as citizens, voters and taxpayers. As individuals, many have strong personal and political views on government spending and taxation, and what it may mean for the country over the coming generations. However, this can be distinct from whether deficits directly or indirectly impact the economy and markets. From a portfolio perspective, investors typically worry about how the debt is measured, whether it will cause interest rates to rise over time past the pandmic, if it will drive up taxes, and more. Here are three facts to keep in mind.
First, while the dollar amount of the national debt and deficit are important, what matters more is their size relative to the economy. The fact that the national debt has grown significantly may be troubling in isolation, but the economy has also grown roughly 60% over the past decade. The annual budget deficit in particular is large in dollar terms and amounted to 12% of GDP in 2021. This is by no means a small percentage but there have been several periods across history – primarily during economic downturns and wars – when the government has been forced to spend at this level. History shows that, over time, this improves as the economy stabilizes, even if deficits don’t turn into surpluses.
The unfortunate reality is that deficit spending does not seem to be going away, with neither major party focusing on the issue. Thus, it’s important to consider what type of spending is driving the deficit higher. It’s no secret that, over the last two years, the skyrocketing national debt is primarily due to pandemic stimulus programs. Combined, the CARES Act ($2.2 trillion 2020 economic stimulus bill) and subsequent bills amounted to about $5 trillion in new government spending.
Second, about two-thirds of the national debt is held either by the government itself or by U.S. citizens. The amount held by government entities is generally excluded by economists when considering the total size of the debt, since this is the equivalent of moving money from one pocket to the other. Thus, the many headline numbers that focus on total debt rather than “net debt” may not provide the most accurate picture.
That said, many investors worry that growing debt and deficit levels means that Treasuries could be less attractive in the future. In the extreme, this could hamper the government’s ability to roll its debt, possibly leading to skyrocketing interest rates. And while this is a possibility, there have not been signs of it yet. Even in 2011, when Standard & Poor’s downgraded the U.S. debt during the fiscal cliff standoff, investors didn’t sell their Treasuries – they rushed to buy more. Ironically, this is because U.S. debt securities are still the standard for stable, risk-free assets in the world.
In the near-term, interest rates could rise further due to government borrowing and the Fed beginning to “run off” its balance sheet. This would impact long-term interest rates more than Fed rate hikes, which could affect borrowing costs and valuations across the market. Of course, the Fed will do this while monitoring financial conditions.
Third, and perhaps most importantly, markets have done well regardless of the exact level of the government debt and taxes over the past century. As unintuitive as it might seem, the best time to invest over the past two decades has been when the deficit has been the worst. These periods represent times of economic crisis when the government is engaging in emergency spending, which tends to coincide with the worst points of the market. And while this isn’t exactly a robust investment strategy, it does underscore the importance of not over-reacting to fiscal policy in one’s portfolio.
Thus, the topic of the federal debt can be complex and controversial. As with many heated issues, it’s important for investors to separate their concerns and not react with their hard-earned savings or investments. Below are three charts that provide perspective around government spending and taxation levels today.
1 The federal deficit spiked during the pandemic
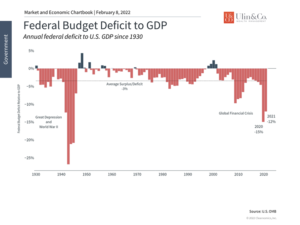
The federal deficit has remained high due to ongoing stimulus programs. While this can be alarming to some, history shows a clear pattern of deficit spending during crises. This then improves once the economy gets back on track.
2 Most Treasuries are held within the U.S.
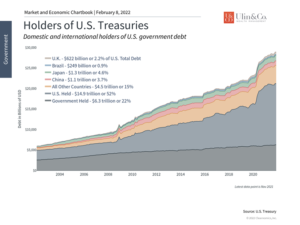
The distinction between total debt and net debt is an important one – the difference being the amount of debt held by the government itself. Additionally, the majority of Treasuries are still held by U.S. individuals and institutions. While international holders are growing in importance, we have not yet reached an inflection point.
3 Tax rates have fluctuated but markets have done well throughout
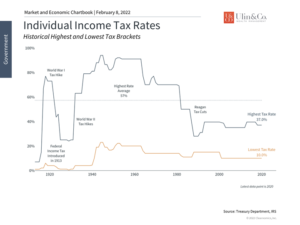
While most individuals do not wish for higher taxes, history shows that the stock market has performed well across different tax rate regimes. During the first half of the 20th century, there were many periods when the highest marginal rates were around 90%. Stock market returns were robust in the 1960s and earlier, just as they have generally been since the 1980s following the Reagan tax cuts.
The bottom line? While the snowballing national debt could lead to a future black swan event, investors ought to maintain perspective on the debt rather than focus on the headline numbers and fears.
For more information on our firm or to get in touch with Jon Ulin, CFP®, please call us at (561) 210-7887 or email jon.ulin@ulinwealth.com.
You cannot invest directly in an index. Past performance is no guarantee of future returns. Diversification does not ensure a profit or guarantee against loss. All examples and charts shown are hypothetical used for illustrative purposes only and do not represent any actual investment. The information given herein is taken from sources that IFP Advisors, LLC, dba Independent Financial Partners (IFP), and it advisors believe to be reliable, but it is not guaranteed by us as to accuracy or completeness. This is for informational purposes only and in no event should be construed as an offer to sell or solicitation of an offer to buy any securities or products. Please consult your tax and/or legal advisor before implementing any tax and/or legal related strategies mentioned in this publication as IFP does not provide tax and/or legal advice. Opinions expressed are subject to change without notice and do not take into account the particular investment objectives, financial situation, or needs of individual investors.


