Inverted Yield Curve- Don’t Fight The Fed Fighting Inflation
The U.S. economy is painfully churning through an inflation burdened bear market like a slow-moving hurricane that may not become as severe as the Great Recession 14 years ago when the S&P 500 index plunged nearly 60%, with repercussions felt across most all financial and credit markets.
Still, there was no safe place to hide for the first half of 2022 for diversified investors. After passing a market low on June 16th, for the first time in a while, bond and stock negative correlations are working. The diversification benefits of bonds appear to be improving as fixed income is finally again acting as a hedge to equity volatility while providing healthy dividends for the first time in three years.
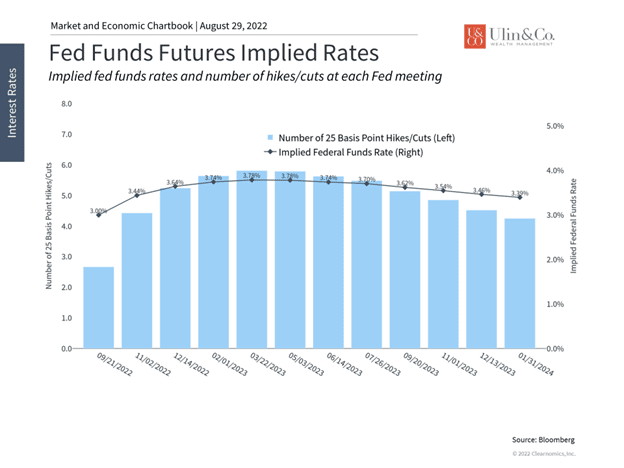
Investors face a wide range of outcomes, uncertainty and volatility moving forward as the Fed has taken a more hawkish turn to hike short term rates over the next year to help cool off inflation with the goal of attaining a 3.75 to 4% Fed funds rate.
Watch the Quants
Are thousand-point market moves making you a bit queasy? As we have discussed many times in the past, not all extreme market volatility is derived from humans calling up their brokers and demanding to “sell everything,” but driven by AI and quants.
There are studies indicating that algorithm-driven “quantitative investing” systems account for more than 60% of stock trades, especially in more volatile environments. Trading algorithms respond to the same evidence as humans and are trained to sniff out, yet quickly trade on broad indexes to individual companies if they recognize certain triggers. These tech systems can be reading tweets overnight and then selling specific stocks or sectors at the opening bell – before you even finish your morning coffee.
More than just facts and numbers, it is perhaps more concerning that robo-algorithms can even gauge the words, speaking tone and inflection of a human, such as Fed Chair Mr. Jay Powell, while identifying signs of how people may trade from his outlook. These quant-driven trades can end up triggering panic among humans to start selling stocks- thereby feeding a brutal cycle that leads to more quant trading.
Inverted Yield Curve Repercussions
As noted recently in Seeking Alpha on yield curve inversions (1) The inverted yield curve is bearish short-term, but bullish long-term (2) While inverted yield curves have always preceded recession, this time it might be a sign of easing inflation and (3) The US has never entered a major recession with 3.5% unemployment.
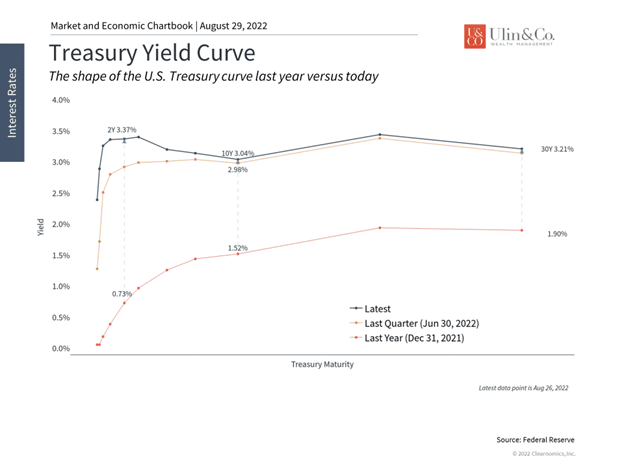
The surprise July market recovery and record month for stocks has hit a wee-bit of a bump due to uncertainty around interest rates and the Fed. Rates have driven markets all year with significant impacts on stock and bond prices, economic growth, the housing market, and more. In an environment like this, market expectations matter just as much, if not more, as the actual numbers, and this is reflected in the yield curve. Today, the yield curve is not just inverted, but is unusually shaped compared to recent history due to the Fed’s battle with inflation and the slowing economy.
Although the yield curve is a technical concept, the basic idea is simple. A yield curve is just a graph that shows the level of interest rates at different time horizons, or maturities. This tells you what interest rate you would earn if you invested in a new bill, note or bond for that duration, be it 3 months or 30 years. When investors talk about the yield curve, they are typically referring to one based on government-issued U.S. Treasuries since these are considered to be the safest fixed income securities.
The yield curve is inverted

Traditionally, economists and market professionals look at the difference between 10-year and 2-year Treasury yields. When the difference is positive, we say that the yield curve is “steep” (it slopes upward to the right, as it did a year ago). When the difference is small, we say that the yield curve is “flat.” When the difference is negative, i.e. 2-year yields are above 10-year yields, the curve is inverted (it slopes downward to the right), as it is today.
This is related to the economy because the yield curve tends to flatten as lower growth expectations push down long-term interest rates. Eventually, long-term rates may fall below short-term rates, which are often still high because of Fed policy, thus causing the yield curve to invert. In contrast, when the economy is expanding or coming out of a recession, the yield curve typically has a positive slope and investors are rewarded with higher yields for holding longer-term bonds. If future growth expectations are high, interest rates are expected to follow a rising path, and the yield curve steepens.
The Fed has reiterated its plan to fight inflation with higher rates

The yield curve has already inverted twice this year as the 2-year Treasury yield surpassed the 10-year yield in March and again in July due to the economic slowdown. Today’s unusual curve represents the fact that the Fed will need to keep short-term rates high in order to combat inflation, even as long-term growth expectations fall. As the chart above shows, the market expects the Fed to increase policy rates to about 3.75% by early next year, up from a target range of 2.25% to 2.50% today, before allowing rates to moderate.
Thus, the key to understanding this dynamic is that they reflect market expectations today. In other words, investors already know that inflation is high, the economy is decelerating somewhat, and that the Fed is accelerating its rate hikes in order to prevent further price increases. What remains uncertain is how quickly inflation might come down and how long the Fed will keep raising rates. This is one reason markets pulled back last week when Fed Chair Jerome Powell, in his speech at Jackson Hole, reiterated the Federal Reserve’s dedication to fighting inflation with rates that could remain higher for longer. In the Fed’s view, it is important to fight inflation today to prevent persistent price increases even if it risks slowing the economy further.
The housing market has softened

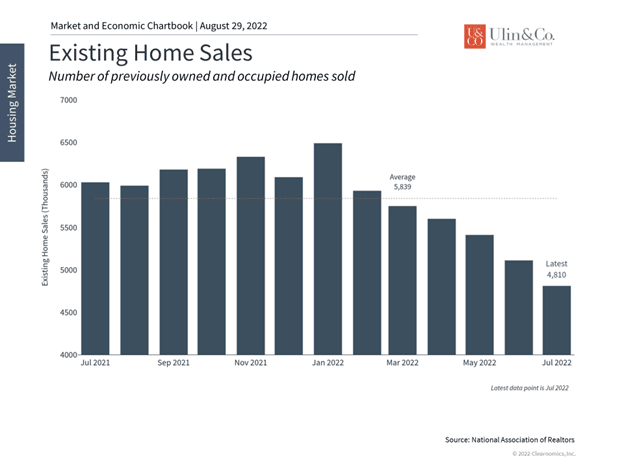
As it has all year long, interest rates that remain high or continue to rise could impact investors and consumers in many ways. Mortgage rates, for instance, are at their highest level since the global financial crisis, with the 30-year fixed averaging near 6%. These higher borrowing costs have cooled the housing market. The number of housing starts, new building permits, and existing homes sold have declined. The number of months of new home inventory, which is the ratio of new homes for sale vs sold, has risen to 10.9, the highest since the Great Recession.
In this environment, investors ought to remain patient. Inflation will take time cool down which means that the fed funds rate will likely remain high through the first part of 2023. A slowing economy, after the rapid historic recovery over the previous two years, is natural and expected. The fact that the Fed needs to thread the needle between these two challenges increases the odds of market over- and under-reactions. As always, avoiding the urge to overreact, especially during temporary pullbacks and periods of rate volatility, is the key to staying on track to achieve long-term financial goals.
The bottom line? The market recovery has hit a snag as investors adjust to new Fed expectations. With the yield curve still inverted, long-term investors ought to stay patient as inflation eases and the economy enters a new phase of the cycle.
For more information on our firm or to get in touch with Jon Ulin, CFP®, please call us at (561) 210-7887 or email jon.ulin@ulinwealth.com.
You cannot invest directly in an index. Past performance is no guarantee of future returns. Diversification does not ensure a profit or guarantee against loss. All examples and charts shown are hypothetical used for illustrative purposes only and do not represent any actual investment. The information given herein is taken from sources that IFP Advisors, LLC, dba Independent Financial Partners (IFP), and it advisors believe to be reliable, but it is not guaranteed by us as to accuracy or completeness. This is for informational purposes only and in no event should be construed as an offer to sell or solicitation of an offer to buy any securities or products. Please consult your tax and/or legal advisor before implementing any tax and/or legal related strategies mentioned in this publication as IFP does not provide tax and/or legal advice. Opinions expressed are subject to change without notice and do not take into account the particular investment objectives, financial situation, or needs of individual investors.


