Debt Ceiling Political Theater
The U.S. has never defaulted on its debt. Yet the so-called “X-date” of when the government will run out of cash is slated to arrive on June 1st. The ominous after-effects of not raising the debt ceiling and paying down interest payments could adversely affect the economy, markets, our credit rating, and the dollar’s reputation. Federal payments tied to treasuries, Social Security, Medicaid, salaries for federal employees, military salaries, and benefits for veterans could take a direct hit.
Should you be overly concerned in the next couple of weeks of the approaching X-date and pivot a good portion of your nest egg to gold bars, metals, crypto, Rolexes and foreign currencies? The short answer is no. To paraphrase Mark Twain, history may repeat and rhyme. We could have a repeat of 2011 showdown and market turbulence, but even if so, would be short lived.
We’ve seen this political theatre play-out many times before. Even with the discord on the Hill, neither party may want to be remembered for creating a historic economic catastrophe. In fact, every President back to Eisenhower and up to Biden has increased the debt ceiling. According to the Congressional Research Service, the debt ceiling has been raised 102 times since World War II. Simply put, the U.S. cannot afford to have its reputation tarnished. Our credit rating and the value of the U.S. dollar is viewed as a barometer of America’s importance on the global stage.
Checks and Balances
Most other countries set their annual debt and spending limits as a percentage of their GDP. For the United States to operate year to year in this manner with checks and balances is a bit lunacy and leads to major political fighting in Washington, but also may help us as a country to pay more attention to how much the government is earning in revenues vs spending on different programs every year.
Black Swans
The more encompassing issue than the annual debt ceiling political theater, is that the federal debt has doubled over the past decade and, with very few exceptions, has grown nearly every year, adding fears to a future potential government catastrophe and potential black-swan event. If you are seeking an ominous forecast, look no further than the US Debt Clock “time machine” website data (usdebtclock.org) that has a chart predicting the U.S. debt to be near $43 Trillion by 2026.
How did we get here so quickly? As of March 2021, COVID costs totaled $5.2 trillion between Presidents Trump and Biden. In retrospect World War II cost $4.7 trillion (in today’s dollars). All-in money printing totaled $13 trillion: $5.2 for COVID + $4.5 for quantitative easing + $3 for infrastructure. Mountains of money cause inflation that was further fueled by demand-side shocks. Simply put, we created new money on loan that will be paid for by future generations
After 14 years of low interest rates, there should also be a wee-bit of concern on today’s higher interest rates attached to the snowballing debt. The almost $32 Trillion U.S. debt that is growing by billions each year, currently has a debt to GDP ratio of 120%, whereas two decades ago the ratio was closer to 58%, according to usdebtclock.org. Logically, as interest takes up more of the budget, we will have less available to spend on social benefits and other government programs. If the government wants to maintain the same level of benefits and services over time without running large deficits, more revenue will be required by hiking income taxes.
Debt Ceiling and your Portfolio
Investors are understandably nervous about Washington failing to reach an agreement, a possibility that both sides agree would be a self-inflicted catastrophe. While it’s unclear how this will play out in the coming two weeks, the fortunate news is that financial markets are mostly taking these events in stride. More so than the concern over the approaching “X” date we are leaning a bit more to a conservative stance for our clients strategic balanced portfolios as we are still not out of the woods from the great- inflation, slow-burning bear market that incepted January 2022. Consider the following three points
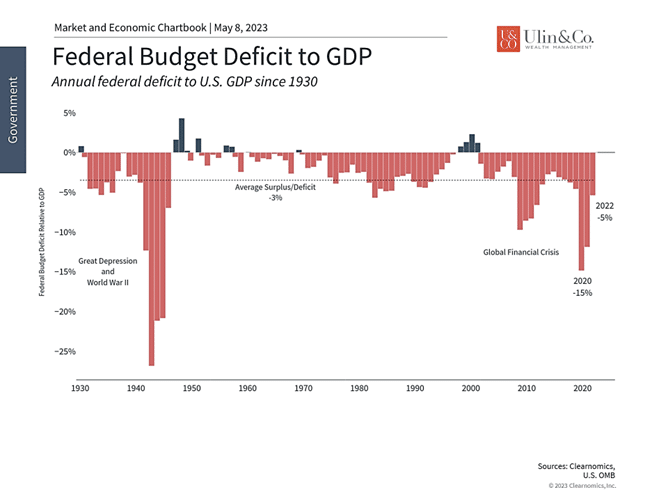
First, it’s important to understand what the debt limit is and is not. In simple terms, the federal government borrows money to pay its bills by issuing Treasury securities. This is necessary because the federal government often operates with a deficit whereby spending (on defense, Social Security, emergency pandemic stimulus, and more) exceeds government revenues (which consist primarily of tax revenues). While tax revenues increase as the economy grows (even without raising tax rates), they have been outpaced by spending over time. This borrowing adds to the national debt which hit the $31.4 trillion debt ceiling in January.
Federal borrowing reached the debt limit this past January

Thus, the only question around the debt ceiling is whether the government can and should pay its bills. This is akin to signing the papers for a new car then afterwards requesting an increase to your credit limit. For most of us, the decision to buy something can’t be separated from whether we will pay for it, even if it’s with debt. Unfortunately, the Congressional process for approving a budget by September 30 each year is separate from whether the Treasury can actually pay the bills.
Second, the large and ever-growing national debt is a controversial topic that impacts the economy and markets in complex ways. At the moment, Democrats, who control the White House and Senate, and Republicans, who control the House of Representatives, are in a standoff. On April 26, the House passed a debt limit bill by a narrow vote margin of 217 to 215. This would increase the debt limit through March 31, 2024, or until the national debt increases by another $1.5 trillion. However, it also includes provisions such as discretionary spending limits, the repeal of renewable energy tax credits, increased work requirements for benefits programs, and others. This makes it politically fraught and thus unlikely to pass the Senate and be signed into law.
As usual, there is plenty of political grandstanding around this issue with each side trying to gain the upper hand. Similar debt ceiling standoffs have occurred over the past decade with the limit suspended and raised in 2013, 2014, 2015, 2017, 2018, 2019 and 2021.
Fortunately, despite the headlines and investor concerns, these episodes had little long-term impact on markets. The U.S. has never defaulted on its debt, and nearly all economists and policymakers agree that doing so would lead to turmoil in the financial markets and increase borrowing costs for businesses and everyday citizens. This risk is evident in the bond market with a sharp jump in Treasury rates with maturities around the debt ceiling deadline, and much lower rates thereafter.
The one exception to markets staying relatively calm occurred in 2011 when a similar standoff led Standard & Poor’s, a credit rating agency, to downgrade the U.S. debt. After then President Obama waited till the night before the deadline to approve increasing the debt ceiling, the stock market fell into correction territory with the S&P 500 declining 19%. Could history repeat itself? Perhaps. Ironically, the prices on Treasury securities increased during the 2011 debt ceiling crisis because, even though these were the exact securities being downgraded, investors still believed they were the safest in the world at a time of heightened uncertainty. The debt ceiling was eventually raised and a new budget was approved, allowing markets to bounce back greatly in 2012.
Income tax rates are still low

Third, while everyone generally agrees that the government should not spend more than it generates in tax revenues, the unfortunate reality is that neither party has addressed the problem over the past decade. The last balanced budgets occurred during the Clinton years and the Nixon administration before that.
So, deficits are unlikely to go away. Given how heated the topic of government spending can be, it’s important for investors to distinguish between their political feelings and how they manage their portfolios. In other words, investors should focus on what they can control in order to differentiate how things work from how they would like them to be. Even after a volatile 2011, the stock market bounced back in action over 13% in 2012.
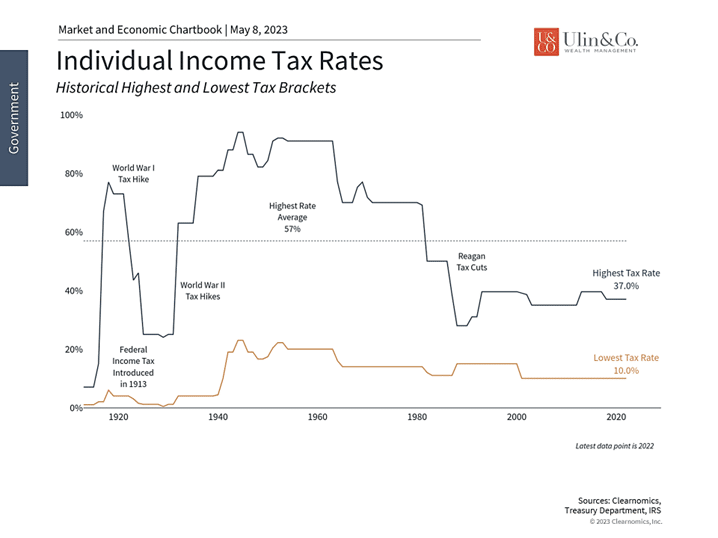
One factor beyond the market and economic effects is that the odds of higher tax rates may increase as the national debt worsens. Today, the highest income tax rates are slightly above their lows after the Reagan tax cuts, but still far below historical peaks. High-earners in the mid-1940s paid rates as high as 94% on their marginal incomes. Even those in the lowest bracket would have paid 20% or more during the 1940s, 50s and 60s – double today’s rates. U.S. corporate tax rates were also among the highest in the world until the 2017 tax cuts. So, while higher tax rates are not guaranteed, engaging in a financial plan that takes advantage of relatively lower rates today can help to protect investors from future tax uncertainty.
The bottom line? The debt ceiling and federal debt need to be resolved in the coming weeks. As with many political issues, it’s important for investors to separate their concerns and not react with their hard-earned savings and investments. History shows that staying invested is the best approach to navigating drama in Washington.
For more information on our firm or to request a complementary investment and retirement check-up with Jon W. Ulin, CFP®, please call us at (561) 210-7887 or email jon.ulin@ulinwealth.com. Get Started Today: Contact Us Below.
Note: Diversification does not ensure a profit or guarantee against loss. You cannot invest directly in an index.
Information provided on tax and estate planning is not intended to be a substitute for specific individualized tax or legal advice. We suggest that you discuss your specific situation with a qualified tax or legal advisor.
You cannot invest directly in an index. Past performance is no guarantee of future returns. Diversification does not ensure a profit or guarantee against loss. All examples and charts shown are hypothetical used for illustrative purposes only and do not represent any actual investment. The information given herein is taken from sources that IFP Advisors, LLC, dba Independent Financial Partners (IFP), and it advisors believe to be reliable, but it is not guaranteed by us as to accuracy or completeness. This is for informational purposes only and in no event should be construed as an offer to sell or solicitation of an offer to buy any securities or products. Please consult your tax and/or legal advisor before implementing any tax and/or legal related strategies mentioned in this publication as IFP does not provide tax and/or legal advice. Opinions expressed are subject to change without notice and do not take into account the particular investment objectives, financial situation, or needs of individual investors.


