Black Monday Deja Vu -Massive Stock Swings
October. This is one of the peculiarly dangerous months to speculate in stocks. The others are August, January, September, April, November, May, March, June, December, July, and February. – Mark Twain
It seems like a lot of chaotic days in the stock market occur on Mondays as well as in the months of August and October. As long-term retirement investors, make sure to hone your “inner Mark Twain” and not hit your panic or trade button and cash out based on market maxims, days of the week or thousand-point market swings in one day.
When counseling our clients to minimize market volatility induced insomnia, we focus on market history combined with investing fundamentals and behavioral finance. Taking swift action with your portfolio based on increased volatility or headlines can quickly derail an investor’s goals more so than actual market events.
Bearing in mind a fever is a good indication that the immune system is doing its job to stimulate the body’s defenses to destroy the cause of an infection, perhaps the recent weeks rollercoaster ride on Wall Street with the VIX flashing an unusually high temperature level was not a medical emergency to dial 911 or your broker, but a sign that the fever of record high inflation and interest rates are nearing their end, and a new era is starting to evolve with the stock market.
Flash Crash
Nine things that may scare the pants off you may include roller coasters, horror movies, heights, flying, spiders, snakes, sharks, dentists and loud noises. It may come as no surprise that we have utilized most all of these analogies in our newsletters except dentists. The recent stock market moves should not come completely unexpected. While last week may have felt like a horror movie, it was short lived.
Some of our older clients in, or nearing retirement called us early last Monday morning concerned by the historic thousand-point plus “flash crash” of the DJIA index at the market open with more than a few brokerage houses reporting portal crashes limiting client access. Following the recent Monday low of -3%, -4.25% and -6.3% for the DJIA, S&P 500 and NASDAQ indexes, all three posted a remarkable recovery back up +2.41%, +4.06% and +5.51% by Friday’s close for the week, as if Monday’s death spiral was a head-fake or illusion.
More than a 1987 Black Monday déjà vu premonition, some investors got even more spooked by the VIX “fear-index” spiking up past 60 – before finishing the week down back near 20, with media and headlines mulling over this unusual happening like a canary in a coal mine, along with the potential for a major recession to evolve.
We have been discussing with our clients in our ongoing service meetings and calls that recession fears are overblown, the Fed may soon come to the rescue with rate cuts, and the recent few days panic selloff of stocks was overdue and obviously oversold as an outlier event. Still, after about 18 months with nominal volatility on the street, this recent consolidation was undoubtedly necessary to clear the slate and bring down valuations a bit. As a bonus, interest rates decreased – as the 10-year Treasury index fell 20%, to near 4%, boosting bond values up while helping diversified investors.
The Quants
Like 1987, we reminded our clients that in extreme stock market volatility conditions, ai and quant algorithmic program-driven trading models in our opinion may lead a swift sell off by as much as 50% as a portfolio insurance strategy, in tandem with investor panic. Yet this is not the time to lose sleep or to cash out and buy a bigger mattress, but to buy low and continue optimizing your portfolio.
While a nearly 1000-point drop of the Dow index in one day seems spectacular if not peculiar, consider the 3% drop is not excessive. By comparison, on Black Monday in October of 1987, the Dow Jones (DJIA) index fell 22.6%, or 508 points in one day after hitting a peak of 2,722 a couple months earlier. The Dow would have to drop nearly 9,300 points today to match the 1987 disaster.
Just in case you were losing sleep over a repeat of the original Black Monday 1987 event, circuit breaker trading halt systems were put in place in 1988 in response to a recommendation from the Brady Commission, which was appointed by President Reagan. From its initial adoption in 1988 to the beginning of 2020, the circuit breaker was triggered only once on Oct. 27th, 1997. Then, at the onset of the COVID-19 pandemic, it was triggered four times in 10 days.
The circuit breakers today are set in percentage drops on the S&P 500 Index. A 7% drop halts trading for 15 minutes. A further drop to 13% produces another 15-minute halt. A further drop to 20% produces a close in trading for the rest of the day.
Perspectives on Sell Offs and Investing Through Chaos
Ironically, current macroeconomic conditions – inflation returning to 2%, low but rising unemployment, falling interest rates, and double-digit stock market gains – are exactly what investors had hoped for at the start of the year. Now more than ever, investors need perspective to navigate markets and stay on track to achieve their financial goals. Consider the following points.
Investors need perspective in volatile markets
Investors focused on recent performance alone would no doubt wonder if the cycle is over. While recent market events are still playing out, it’s important to remember that not only are stock market swings normal, but they can also be healthy if they are the result of investors adjusting to new economic facts. This is especially true if valuations improve as prices adjust and corporate earnings continue to grow.
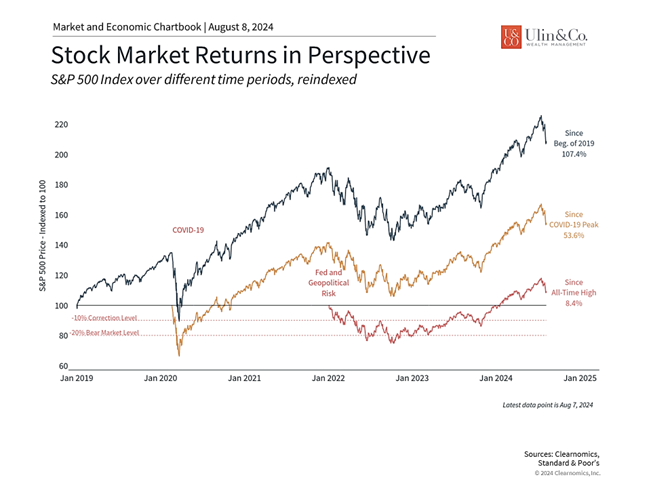
For many investors, the volatility since 2020 may already seem like a distant memory after the steady recovery of the past year and a half. As the accompanying chart shows, the S&P 500 has gained 113% over the past five years, including the pandemic collapse and the 2022 bear market. While market pullbacks are never pleasant, viewing the market on these timescales does help to put the current decline in perspective.
The rotation and now pullback in tech stocks is the result of investor concerns over the magnitude of the rally and large tech company earnings. Whether AI and large language models can live up to their lofty promises has yet to be seen, and it’s not surprising that investors are growing antsy at seeing a return on the billions invested by large companies in these technologies.
So far, market fundamentals still appear to be strong regardless of how stocks move in the short run. Profit forecasts are still positive, with S&P 500 earnings expected to grow 13% over the next 12 months. More than half of S&P 500 sectors are expected to grow earnings by double digits, and all 11 sectors are forecasted to experience positive growth. In the long run, earnings are what drive stock market returns, and thus the health of the economy matters more than short-term stock and sector-specific trading activity.
Sahm Rule – Concerns that the Fed is Again Late to the Game
This is why concerns around the Fed have spooked the market in recent days. The Fed has now kept rates unchanged for over a year as it seeks “greater confidence” that inflation is returning to its 2% target. However, its focus on inflation is now resulting in a weakening labor market, which some fear could spiral toward a “hard landing.”
These dynamics have shifted the Fed’s focus to the labor market, with the Fed acknowledging that it is “attentive to the risks to both sides of its dual mandate.” The latest jobs report showed that the economy added 114,000 new jobs in July, lower than the consensus estimate of 175,000. Unemployment, which was expected to remain at 4.1%, rose to 4.3%. While this is still relatively low compared to history, it is the highest rate of unemployment we’ve seen since the pandemic start (2019).
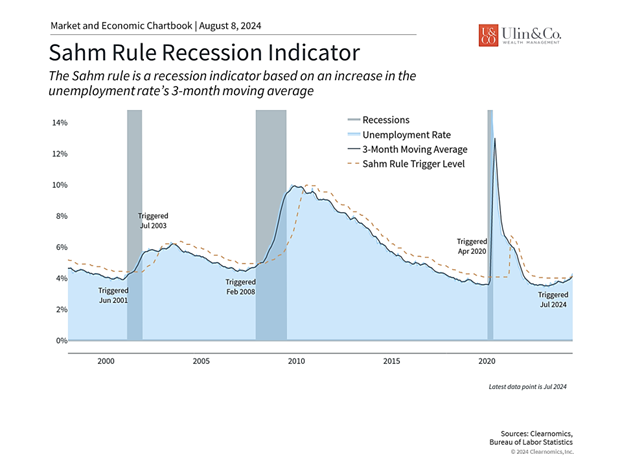
One reason economists are concerned about this increase in unemployment is an economic indicator known as the Sahm rule, shown in the accompanying chart. The Sahm rule, named after a former Fed economist, predicts the onset of recessions based on the trend in unemployment. The simple intuition is that a sudden jump in the unemployment rate is highly correlated with economic downturns. In fact, the very definition of a recession depends on the state of the job market. This is yet another market indicator like the inverted yield curve that may end up being incorrect this time around.
Regardless, both sides of the Fed’s mandate – maximum employment and stable prices – now point strongly to a September rate cut if not a half point cut to start the process. Investors are now worried that the Fed has waited too long to cut rates.
Whether this is the case has yet to be seen. There have been several historical instances that could be called “soft landings.” Perhaps the most notable occurred from 1994 to 1995 under Fed chair Alan Greenspan when the Fed doubled the federal funds rate from 3% to 6%. Inflation remained under control and the economy continued to grow, avoiding a recession.
Despite the positive outcome, this was a harrowing time for investors since it resulted in the worst bear market for bonds up to that point. However, it’s clear that the outcome was positive in the long run, since it set up the conditions for stocks and bonds to continue their long bull runs.
Historical hard landings, on the other hand, have often been the result of policy missteps rather than just sub-optimal timing. The Great Depression, for instance, was worsened by the Fed’s decision to tighten monetary policy at a time when expansion was needed. Similarly, the high inflation of the 1970s can be attributed to the Fed’s overly accommodative stance when prices were rising rapidly. In both instances, the Fed’s actions were essentially the opposite of what economic conditions required, underscoring how severe policy mistakes can be.
Investing is about both returns and managing risk
Investing is never a sure thing. In the classic book “A Random Walk Down Wall Street,” author Burton Malkiel writes that “the stock market is like a gambling casino where the odds are rigged in favor of the players.” Investing in the stock market comes with many risks that can be managed with proper portfolio construction and a long time horizon. History shows that despite the ups and downs of the market, staying invested is still the best way to grow wealth and achieve financial goals over the course of decades.
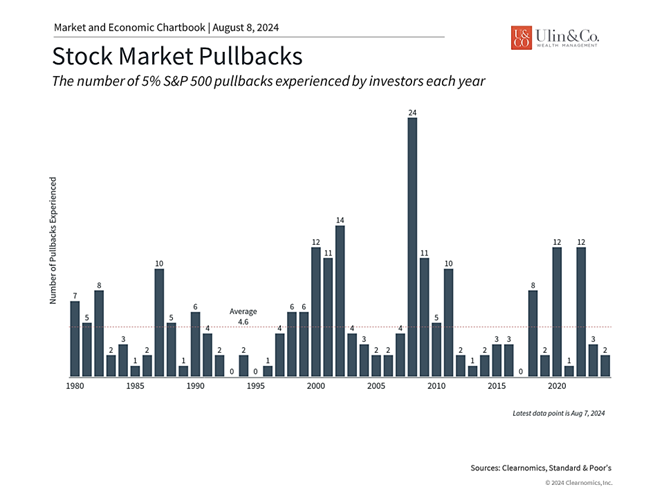
Stocks never move up in a straight line, so how we react to market volatility is perhaps more important than the volatility itself. The S&P 500 has now experienced its second 5% or worse pullback this year. As the accompanying chart shows, this is below the average of 4 to 5 pullbacks experienced in the average year, and the dozens during bear markets. With an average historical annual drawdown of the S&P 500 of 14%, this year overall as had a strong start and with the S&P and NASDAQ indices solidly up year to date.
Additionally, current market concerns driven by tech stocks, the Fed, and the labor market all have their silver linings. The economy is still quite healthy, corporate earnings are still growing, and if interest rates do sustainably fall, many other parts of the market could benefit. As in past episodes of volatility, seeing past the current market moves and headlines is needed to benefit from the long-term trend.
The bottom line? Recession fears are overblown, the Fed may soon come to the rescue with rate cuts, and the recent few days panic selloff of stocks along with the VIX spiking was overdue and obviously oversold. Recent economic data have sparked concerns that the Fed should have cut rates sooner. Tech stocks have also declined as investors worry about valuations and earnings. In volatile markets, it’s important for investors to stay level-headed as they work toward their long-term goals as a new market era is starting to evolve.
For more information on our firm or to request a complementary investment and retirement check-up with Jon W. Ulin, CFP®, please call us at (561) 210-7887 or email jon.ulin@ulinwealth.com.
Note: Diversification does not ensure a profit or guarantee against loss. You cannot invest directly in an index.
Information provided on tax and estate planning is not intended to be a substitute for specific individualized tax or legal advice. We suggest that you discuss your specific situation with a qualified tax or legal advisor.
You cannot invest directly in an index. Past performance is no guarantee of future returns. Diversification does not ensure a profit or guarantee against loss. All examples and charts shown are hypothetical used for illustrative purposes only and do not represent any actual investment. The information given herein is taken from sources that are believed to be reliable, but it is not guaranteed by us as to accuracy or completeness. This is for informational purposes only and in no event should be construed as an offer to sell or solicitation of an offer to buy any securities or products. Please consult your tax and/or legal advisor before implementing any tax and/or legal related strategies mentioned in this publication as NewEdge Advisors, LLC does not provide tax and/or legal advice. Opinions expressed are subject to change without notice and do not take into account the particular investment objectives, financial situation, or needs of individual investors.


